Company News
Avantis Investors Continues to Expand Its Active ETF Lineup:
Avantis Total Equity Markets ETF (AVTM) is designed as a broadly diversified total market solution, investing across U.S., non-U.S. developed and emerging markets exposure.
Why Avantis Investors?
Powered by Financial Science
Our strategies share a common investment approach that combines a philosophy based on financial science with expert implementation aimed at increasing expected returns* and managing risks.
Decades of Real-World Experience
The leadership team has decades of experience delivering repeatable and effective investment solutions across geographies and through different market cycles. The team is well recognized by investors worldwide.
Choice of Optimal Investment Vehicles
Our goal is to deliver low-cost, broadly diversified solutions in a variety of formats, including mutual fund and ETF, so that you can choose the optimal vehicle to fit your circumstances. Please contact your financial advisor to discuss availability.
Built on a Solid Foundation with a Unique Purpose
Avantis Investors is backed by American Century Investments®, a $306 billion** asset manager with a reputation for client care, stewardship and stability—bringing great scale to our efforts and allowing a long-term focus.
**As of 12/31/2025
Choice of Optimal
Investment Vehicles
Avantis Investors utilizes financial science to build investment strategies that target higher expected returns*, are broadly diversified, and executed through an efficient, cost-conscious and repeatable process.
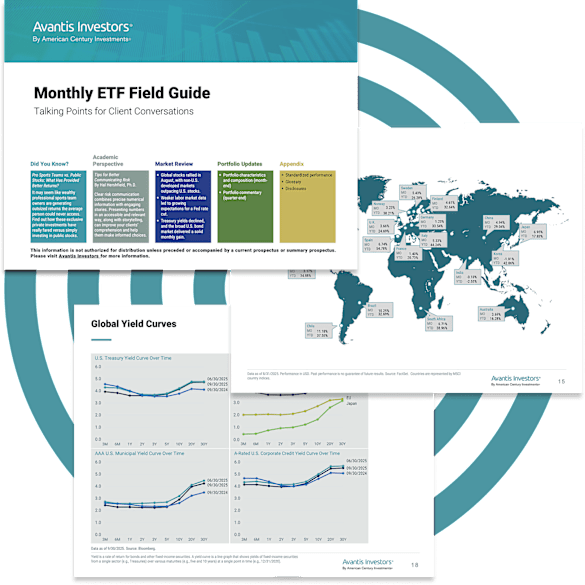
Monthly Field Guide
Download our latest insights for ETFs and Mutual Funds or learn about the Field Guide.
Insights & Perspectives

Behavioral Divide
Beyond the Math, Part 1: The Psychology of Decumulation and Social Security Claiming
APR 28 | 2026
Did You Know?
Context Is Key with Market Volatility
MAR 31 | 2026
Perspectives
Pluralistic Ignorance and Its Impact on Investor Behavior
MAR 31 | 2026
*Expected Returns: Valuation theory shows that the expected return of a stock is a function of its current price, its book equity (assets minus liabilities) and expected future profits, and that the expected return of a bond is a function of its current yield and its expected capital appreciation (depreciation). We use information in current market prices and company financials to identify differences in expected returns among securities, seeking to overweight securities with higher expected returns based on this current market information. Actual returns may be different than expected returns, and there is no guarantee that the strategy will be successful.