What Today’s Valuations Are Telling Investors

In recent weeks, several Wall Street market strategists have warned of lower expected returns for U.S. stocks over the next decade. Current valuations have been a common basis for these pessimistic views.
The difficulty of predicting the absolute level of future stock returns over any period, particularly short periods, is well documented (see Welch and Goyal, 2021). However, we know that research has shown some relation between current valuation ratios and future returns and the equity premium (see Campbell and Shiller, 1998, and Fama and French, 2000).
It’s a simple concept. Higher-than-normal prices versus company fundamentals, like earnings or book values, tend to be followed by lower-than-average returns and lower-than-normal prices versus fundamentals tend to be followed by higher-than-average returns.
So, while strategists may point to the research and the 48% increase in the price-to-earnings (P/E) ratio for the S&P 500® Index over the last 10 years, we believe there’s far more to the story for investors to consider and caution that discipline and sound investment principles like diversification remain paramount. We explain what investors need to know.
Growth Stocks Have Driven Higher Valuations for U.S. Large-Cap Stocks
A reality that may be overlooked when reading grim headlines about future returns is that not all stocks have contributed equally to the rise observed in broad market valuations. Since the focus of the recent predictions has been on U.S. large-caps, we start there, offering insight into how valuations have changed over the last 10 years across the market and within style segments.
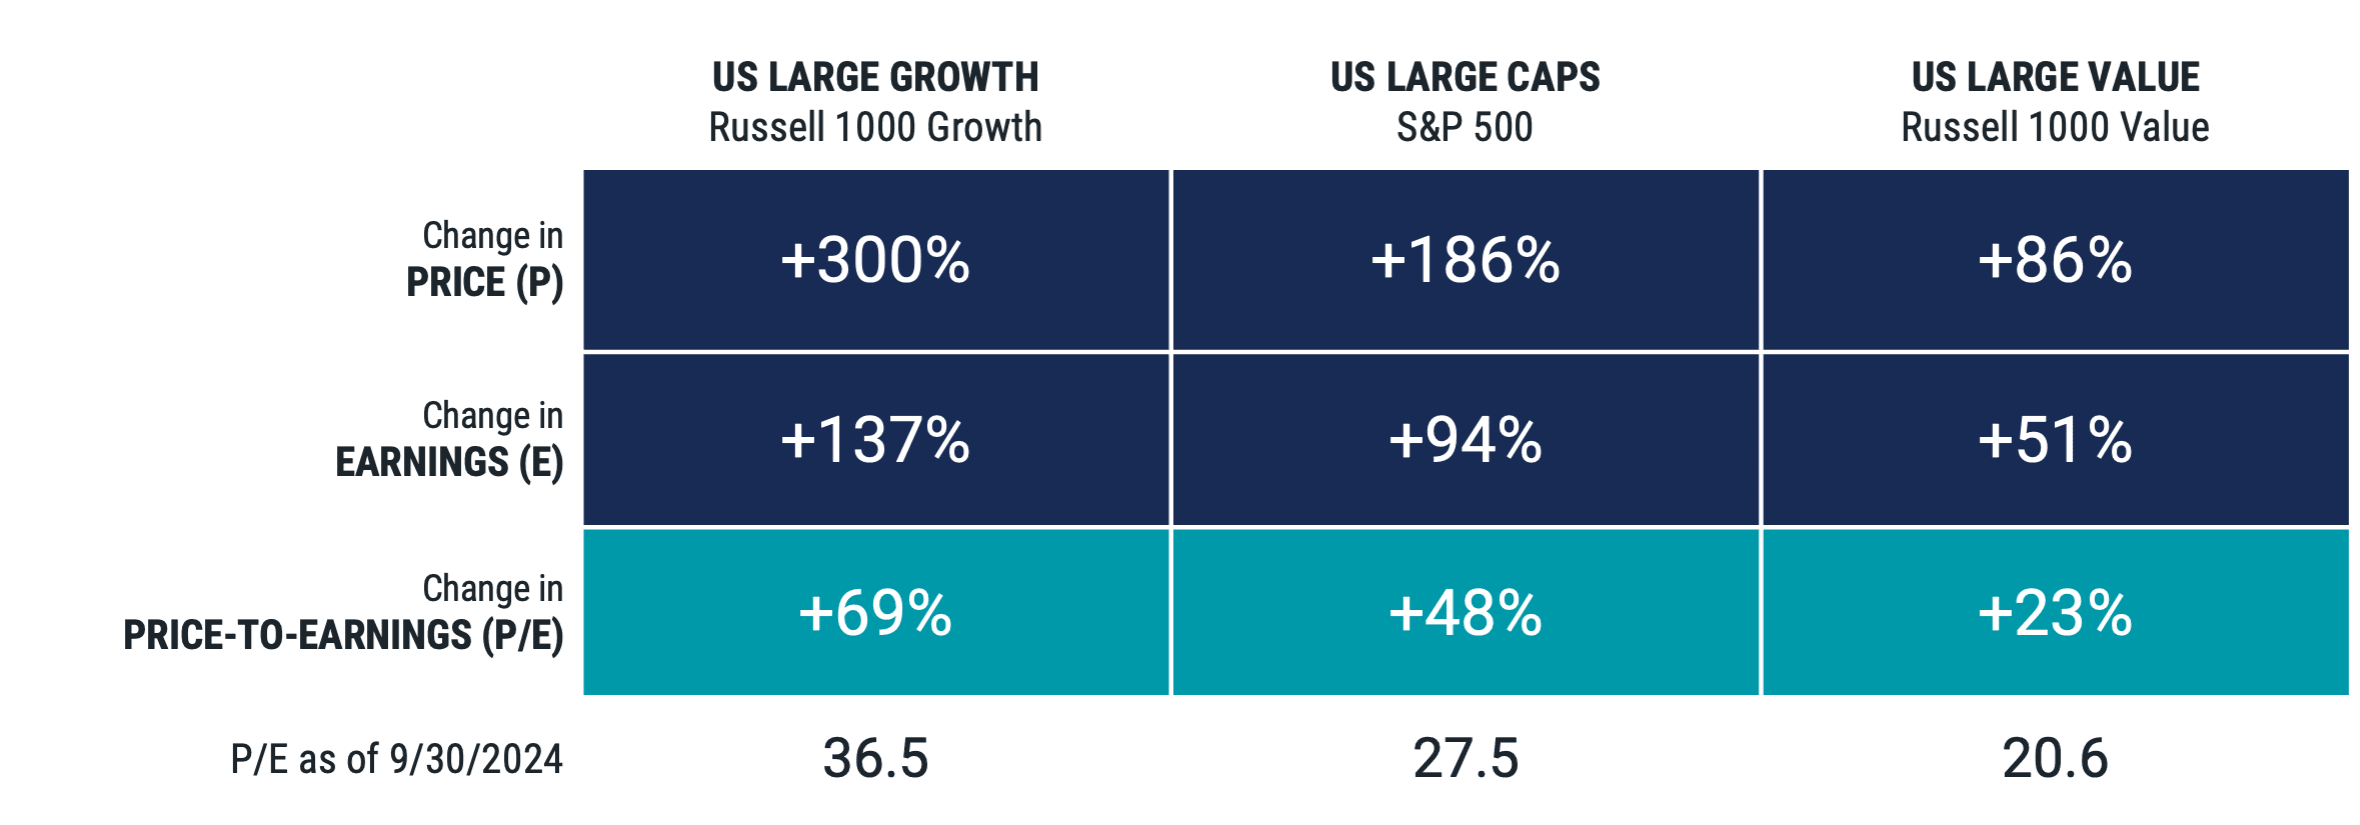
The analysis, shown in Figure 1, highlights that the increase in the P/E ratio for U.S. large-cap stocks has been driven much more by large-cap growth stocks than value stocks. Over the period, the P/E ratio for large-cap growth stocks increased by 69% versus only 23% for large value stocks.
Figure 1 | U.S. Large-Cap and Large Growth Prices Have Risen Much Faster Than Their Earnings Over the Last 10 Years

Data from 10/2014 - 9/2024. Source: Morningstar, Bloomberg. Past performance is no guarantee of future results.
As with any ratio, changes in the numerator (in this case, price) and denominator (earnings) can influence them. Digging deeper into these components helps explain what’s happening within large-caps.
Growth stocks tend to trade at higher multiples because of higher future growth expectations. However, while their earnings have grown 137% over the past 10 years — probably higher-than-expected growth — the price has advanced by much more — a 300% increase over the same time. In comparison, price and earnings growth were much closer for large value stocks at 86% and 51%.
This difference between the price increase and earnings growth has driven current valuations among large growth and value stocks. While we can’t know what will happen in the future, it appears large growth investors are baking in unusually high expectations for future earnings growth, which may or may not materialize.
Looking Beyond U.S. Large-Caps
If we extend our purview, we observe that other areas of the global market have also seen much smaller changes to their P/E ratios than for the S&P 500 and U.S. large growth stocks over the 10-year period. In many cases, P/E has even declined. Figure 2 presents the same data shown in Figure 1 but for U.S. small-cap indexes (Panel A) and non-U.S. market indexes (Panel B).
Figure 2 | Beyond U.S. Large-Caps, P/E Ratios Have Remained Similar or Become More Attractive Over the Last 10 Years


Data from 10/2014 - 9/2024. Source: Morningstar, Bloomberg. Past performance is no guarantee of future results.
Within U.S. small-caps, P/E declined by -19% for the broad small-cap index (Russell 2000® Index). P/E for small value stocks declined even more, at -25%, while small growth stocks’ P/E fell by -8%. Interestingly, earnings growth across all three small-cap indexes was higher than the growth rate for the S&P 500 but with much smaller corresponding price increases (lower change in price than change in earnings for each index).
For non-U.S. stocks, the P/E for international developed stocks was essentially flat over the decade, and for emerging markets stocks, the increase was 22% — still much lower than for the S&P 500 and U.S. large growth stocks.
Different Look, Same Story
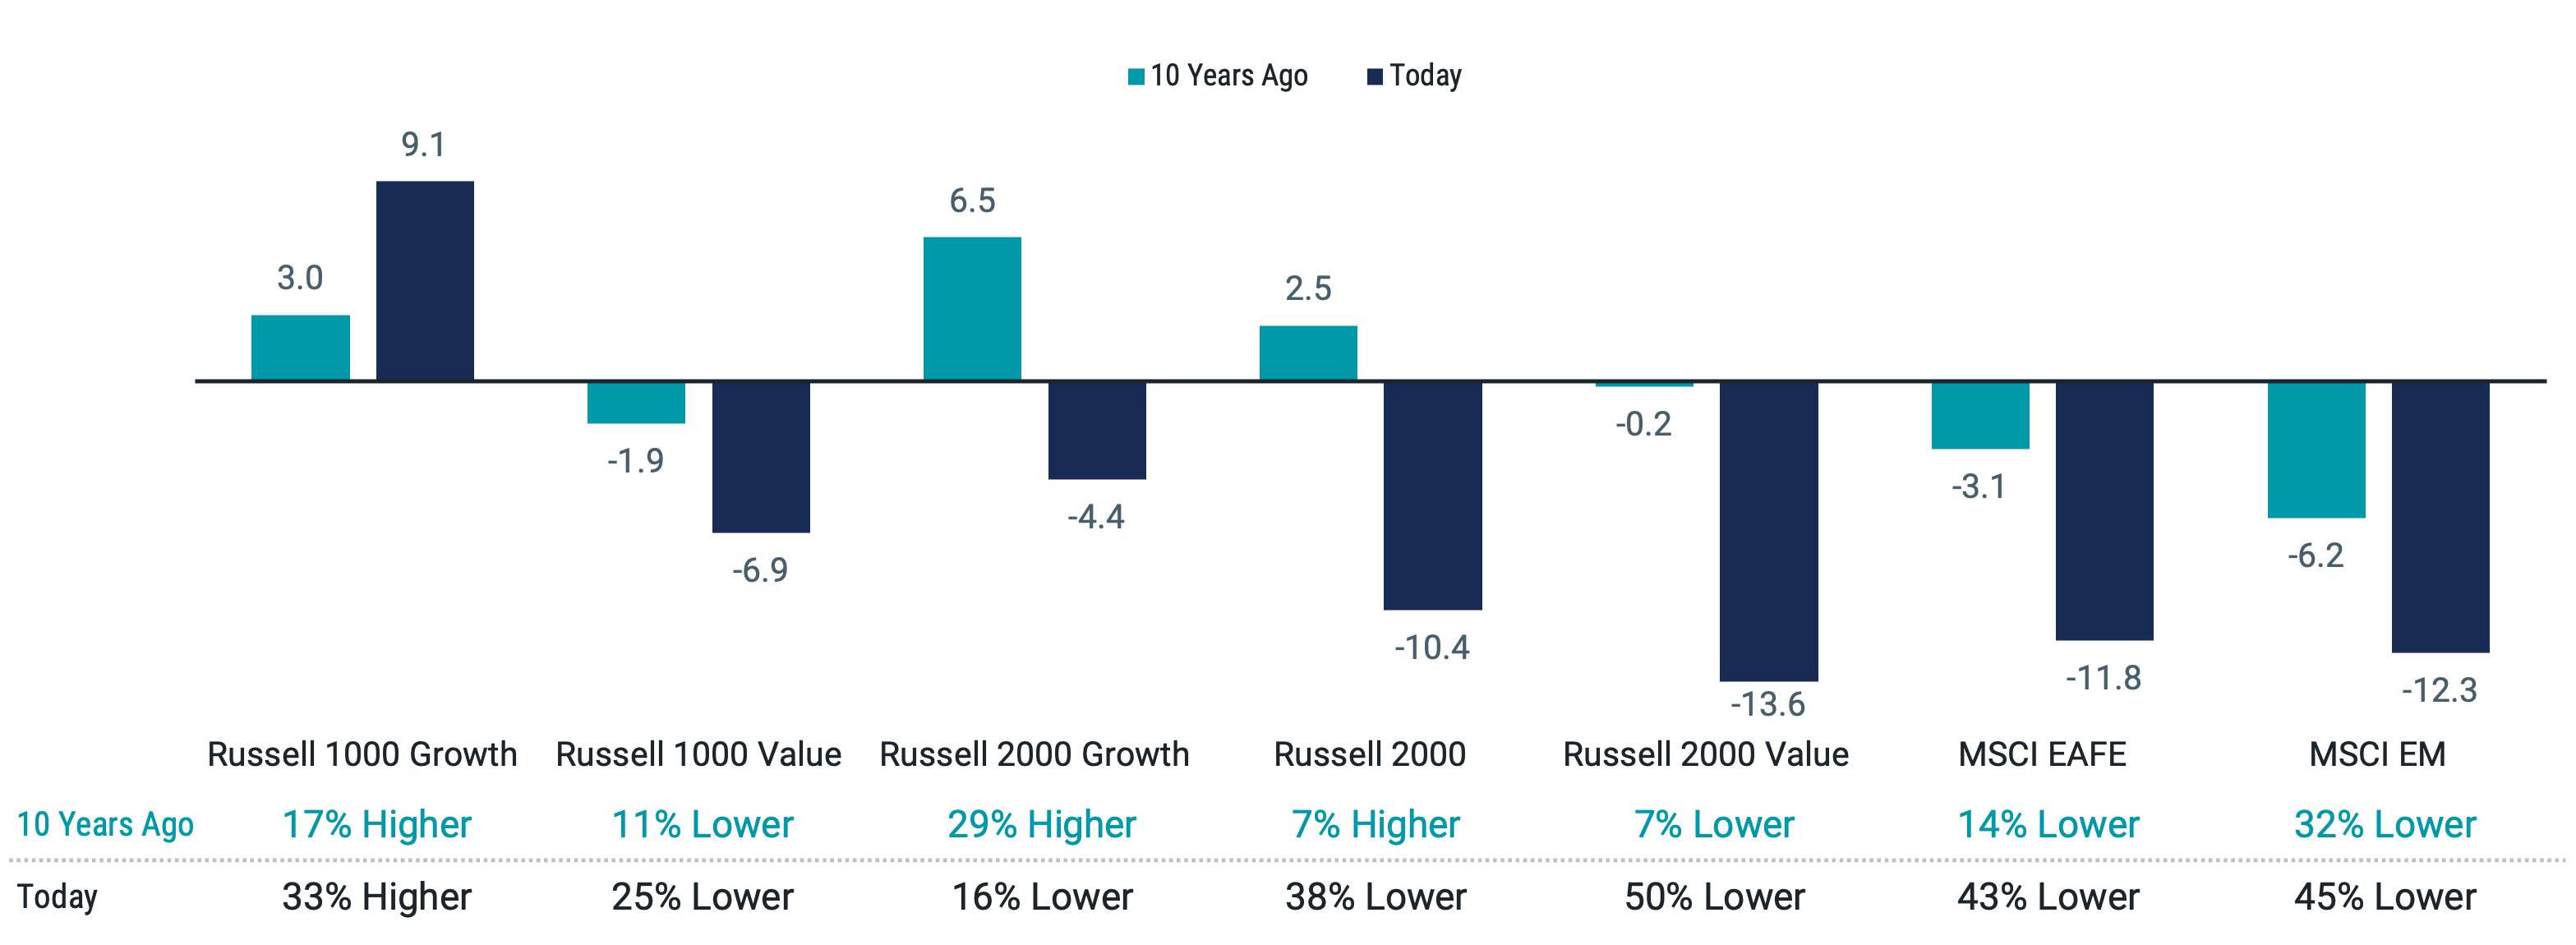
Figure 3 presents similar data as Figures 1 and 2 through a different lens. What can be implied from the prior exhibits is made explicit here through relative valuation spreads. While there are typically differences in valuations among asset classes (e.g., U.S. market P/E tends to be higher than the P/E for non-U.S. markets), over the last 10 years the difference between P/E ratios of the S&P 500 Index and other asset classes has widened. Valuations for all asset classes became more attractive relative to the S&P 500, with one exception — U.S. large-cap growth stocks.
Figure 3 | Change in Valuation Spreads of Global Asset Classes vs. the S&P 500

Data from 10/2014 - 9/2024. Source: Morningstar.
Why does this matter? Think back to what we said about the research into valuations and future returns. Investors who consider and emphasize more attractive valuations within their portfolios are expected to fare better over time and on expectation, even more so when we see wider valuation spreads than normal.
A Note on Valuations Within Asset Classes
While valuations across asset classes offer information to investors, we should also be careful just to take the surface asset class valuations as being assigned to all stocks within a representative index. Even in the commonly mentioned broad categories like U.S. large-caps and U.S. large growth stocks, we observe differences in valuation ratios. Not all stocks that are given these labels are the same.
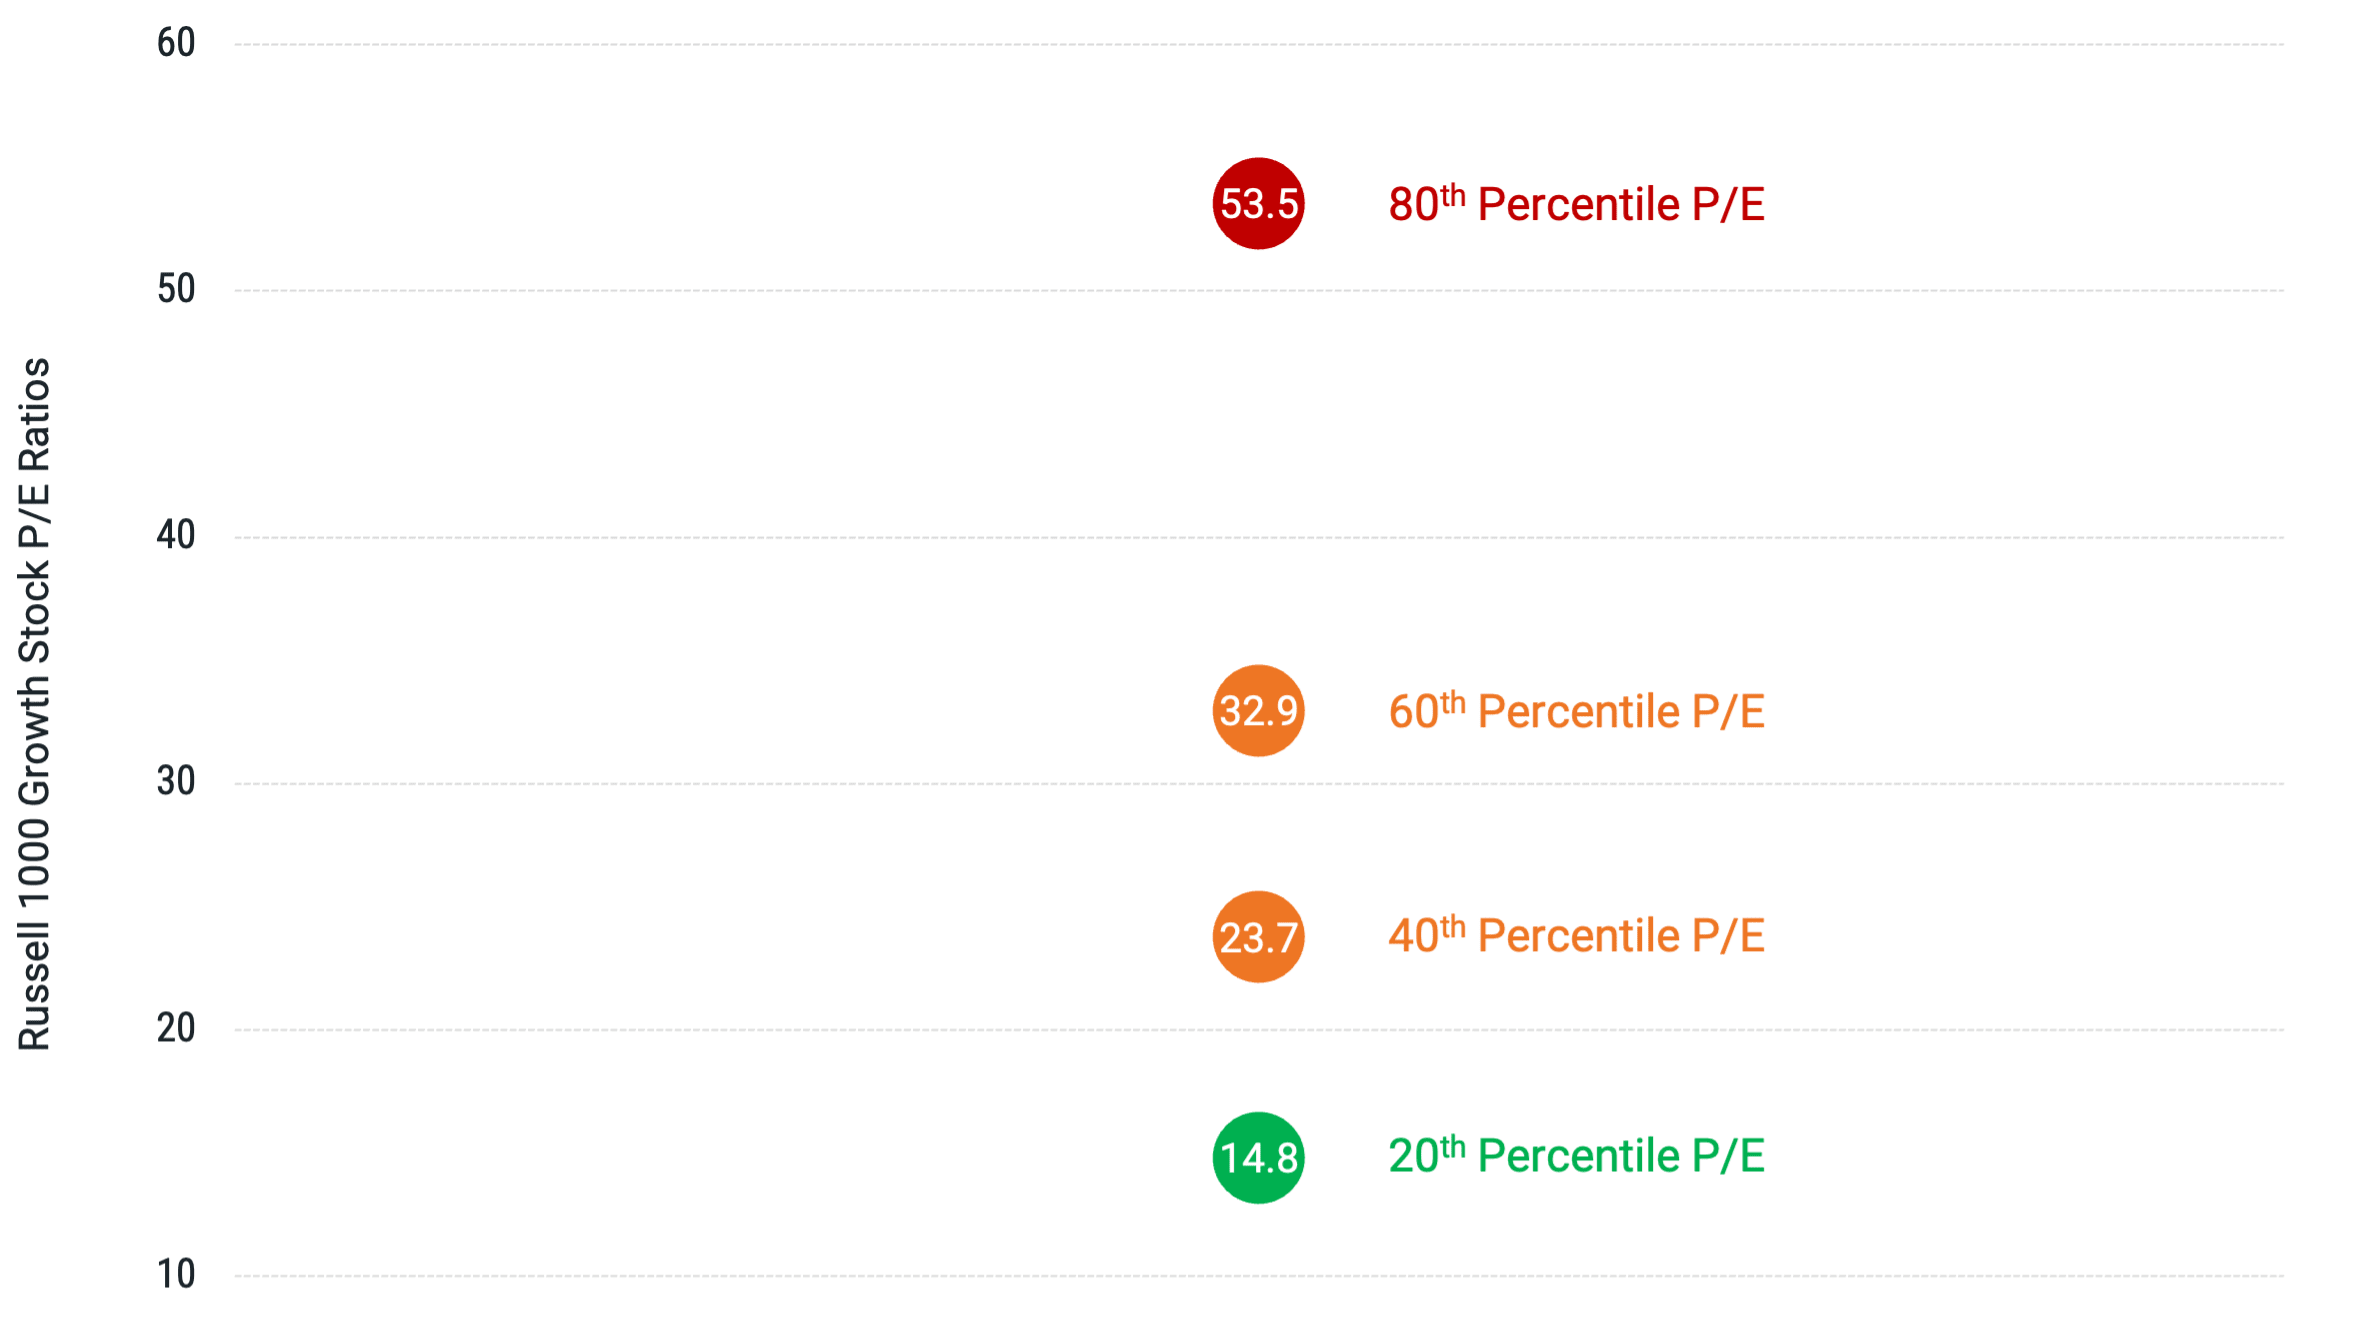
Figure 4 demonstrates that U.S. large-cap growth stocks show meaningful dispersion in valuations among companies within the large growth index. At the 80th percentile, we find a P/E ratio of 53.5 versus only 14.8 at the 20th percentile. The key takeaway is that elevated valuations in the aggregate for a given asset class aren’t necessarily a reason to avoid that area of the market entirely.
Figure 4 | Differences in Valuations Within U.S. Large-Cap Growth Stocks

Data as of 9/30/2024. Source: Bloomberg.
There are still potential diversification benefits from holding stocks across markets and asset classes. However, we can do better by considering differences in valuations within these asset classes to target or emphasize companies that offer higher expected returns going forward.
Final Thoughts
We know that reading negative headlines about where the market is headed can be disconcerting, but don’t lose sight of the fact that people predict bad news for the market with relatively high frequency. They’re very often wrong, so maintaining discipline is important.
We can take comfort in knowing that if we diversify across markets and asset classes, we are ensured of having exposure to those segments of the market that offer attractive relative valuations. Also, if one area of our portfolio disappoints compared to expectations, then other parts of our portfolio may do better. That’s the power of diversification.
If we also remain aware of those differences in valuations and intentionally emphasize more attractive stocks and deemphasize less attractive ones, we can expect that to drive even better outcomes over the long term.
Explore More Insights
Glossary
Expected Returns: Valuation theory shows that the expected return of a stock is a function of its current price, its book equity (assets minus liabilities) and expected future profits, and that the expected return of a bond is a function of its current yield and its expected capital appreciation (depreciation). We use information in current market prices and company financials to identify differences in expected returns among securities, seeking to overweight securities with higher expected returns based on this current market information. Actual returns may be different than expected returns, and there is no guarantee that the strategy will be successful.
Fundamentals: Investment "fundamentals," in the context of investment analysis, are typically those factors used in determining value that are more economic (growth, interest rates, inflation, employment) and/or financial (income, expenses, assets, credit quality) in nature, as opposed to "technicals," which are based more on market price (into which fundamental factors are considered to have been "priced in"), trend, and volume factors (such as supply and demand), and momentum. Technical factors can often override fundamentals in near-term investor and market behavior, but, in theory, investments with strong fundamental supports should maintain their value and perform relatively well over long time periods.
MSCI EAFE (Europe, Australasia, Far East) Index: Designed to measure developed market equity performance, excluding the U.S. and Canada.
MSCI Emerging Markets Index: A free float-adjusted market capitalization index that is designed to measure equity market performance of emerging markets.
Price-to-Earnings Ratio (P/E): The price of a stock divided by its annual earnings per share. These earnings can be historical (the most recent 12 months) or forward-looking (an estimate of the next 12 months). A P/E ratio allows analysts to compare stocks on the basis of how much an investor is paying (in terms of price) for a dollar of recent or expected earnings. Higher P/E ratios imply that a stock's earnings are valued more highly, usually on the basis of higher expected earnings growth in the future or higher quality of earnings.
Russell 1000® Growth Index: Measures the performance of those Russell 1000 Index companies (the 1,000 largest publicly traded U.S. companies, based on total market capitalization) with higher price-to-book ratios and higher forecasted growth values.
Russell 1000® Value Index: Measures the performance of those Russell 1000 Index companies (the 1,000 largest publicly traded U.S. companies, based on total market capitalization) with lower price-to-book ratios and lower forecasted growth values.
Russell 2000® Index: Measures the performance of the 2,000 smallest companies among the 3,000 largest publicly traded U.S. companies, based on total market capitalization.
Russell 2000® Growth Index: Measures the performance of those Russell 2000 Index companies (the 2,000 smallest of the 3,000 largest publicly traded U.S. companies, based on total market capitalization) with higher price-to-book ratios and higher forecasted growth values.
Russell 2000® Value Index: Measures the performance of those Russell 2000 Index companies (the 2,000 smallest of the 3,000 largest publicly traded U.S. companies, based on total market capitalization) with lower price-to-book ratios and lower forecasted growth values.
S&P 500® Index: A market-capitalization-weighted index of the 500 largest U.S. publicly traded companies. The index is widely regarded as the best gauge of large-cap U.S. equities.
Diversification does not assure a profit nor does it protect against loss of principal.
Investment return and principal value of security investments will fluctuate. The value at the time of redemption may be more or less than the original cost. Past performance is no guarantee of future results.
This material has been prepared for educational purposes only. It is not intended to provide, and should not be relied upon for, investment, accounting, legal or tax advice.
The opinions expressed are those of the portfolio team and are no guarantee of the future performance of any Avantis fund.
©2025 Morningstar, Inc. All Rights Reserved. Certain information contained herein: (1) is proprietary to Morningstar and/or its content providers; (2) may not be copied or distributed; and (3) is not warranted to be accurate, complete or timely. Neither Morningstar nor its content providers are responsible for any damages or losses arising from any use of this information.
Contact Avantis Investors
inquiries@avantisinvestors.com
This website is intended for Institutional and Professional Investors, not Retail Investors.