Weathering the Storm: Historical Lessons for Investors Pursuing Higher Expected Returns
Chief Investment Officer
VICE PRESIDENT & SENIOR PORTFOLIO MANAGER
We all invest with the goal of growing our asset values. Our investment allocations include risky assets that have higher expected returns*, but sometimes we wonder if the risks associated with these investments are worth taking. We feel comforted when markets go up, but worried when markets underperform—sometimes to the point that we’re tempted to divest from equity investments and move to perceived safer options.
Economists specializing in behavioral finance study how emotions affect investment decisions to provide insights on coping with the uncertainty that markets bring.¹ Generations that live through great market crashes tend to be more risk averse with more conservative asset allocations.² But overcoming emotions and embracing market uncertainty can potentially be rewarding for long-term disciplined investors.³
Resolute patience is required to invest in equities and/or other higher expected return asset classes, so creating realistic expectations around the long-term goal and patchiness of the path is imperative. Examining tough periods investors have faced in the past may help us better understand our emotions, so that they hinder us less during times of anxiety.
In the two scenarios that follow, we first compare the rewards and challenges investors would have experienced by investing in U.S. equities instead of the perceived safety of one-month U.S. Treasury bills. We then use that same framework to compare a U.S. small cap value strategy versus U.S. equities.
Equities vs. Treasury Bills
Figure 1 compares the growth of a $1 investment in the U.S. equity market versus one-month T-bills over a 20-year period beginning Dec. 31, 1992. By March 2000, the dollar invested in the market grew to $3.91, enjoying a rate of return beyond what investors would have likely expected. But their faith in the market would probably have been challenged when account values were halved from nearly $4 to about $2 during a period when the market underperformed T-bills significantly. “Why not rebalance to T-bills and keep at least some of the gains?” investors might have asked themselves.
Seeking more certainty by divesting from equities at that time would have meant growing the assets at T-bill rates going forward. In contrast, remaining in the market would have meant continuing to cope with nail-biting uncertainty, but investors would have ultimately been rewarded. Despite large market crashes in 2000 and 2008, the market would have rewarded their 20-year commitment to staying the course over 1992 to 2012—their initial $1 investments would have resulted in $4.93.
FIGURE 1 | GROWTH OF $1 INVESTED IN U.S. STOCKS VS. ONE-MONTH TREASURY BILLS
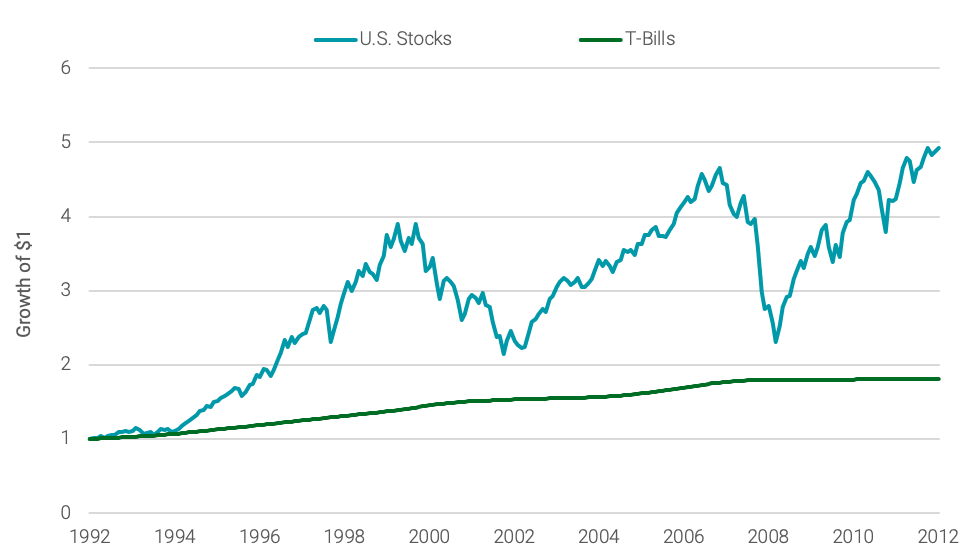
U.S. stocks represented by CRSP Market Index. Data from 12/31/1992-12/31/2012. Source: Fama/French Data Library.
While Figure 1 reflects one distinct 20-year path, Figure 2a shows outcomes of rolling 20-year investment periods that ended every month from June 1946 to January 2020. The higher returns of U.S. stocks (light blue line) relative to Treasury bills (green line) are part of the reward of investing in equities. U.S. stock market outperformance over Treasury bills has been persistent for all 884 20-year periods in our historical data.
FIGURE 2A | ROLLING 20-YEAR GROWTH OF U.S. STOCKS VS. ONE-MONTH TREASURY BILLS
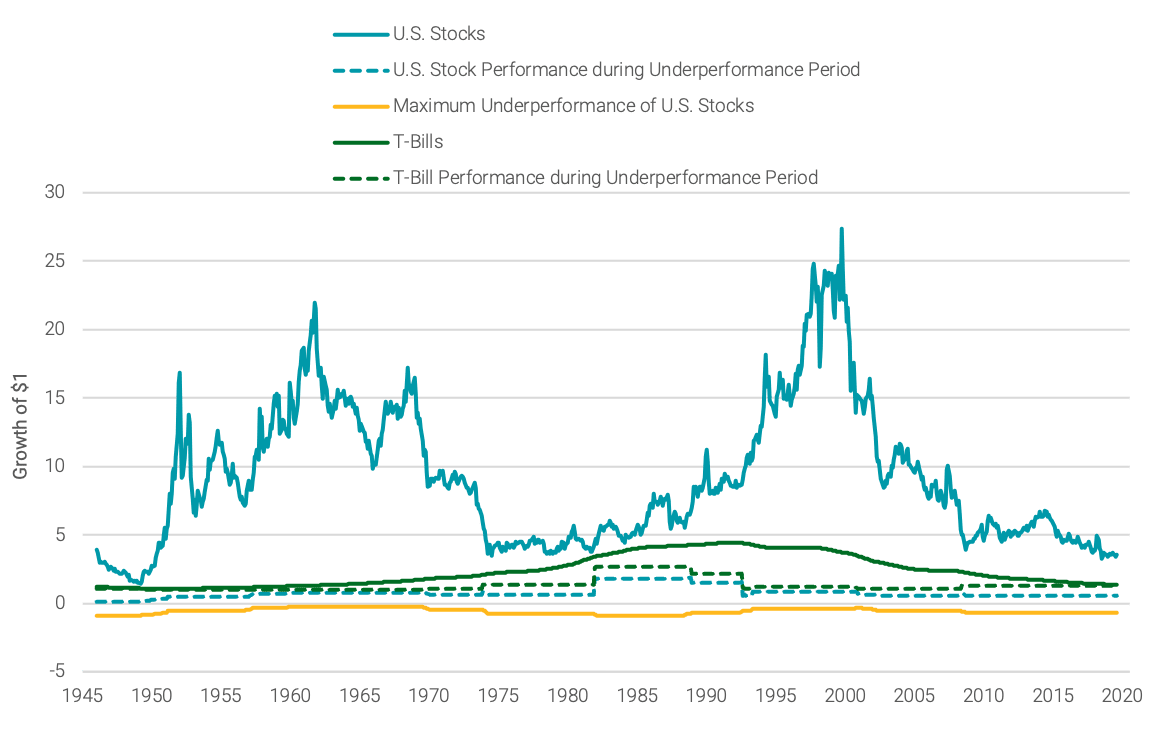
FIGURE 2B | MAXIMUM UNDERPERFORMANCE OF U.S. STOCKS VS. ONE-MONTH TREASURY BILLS IN SUBPERIODS
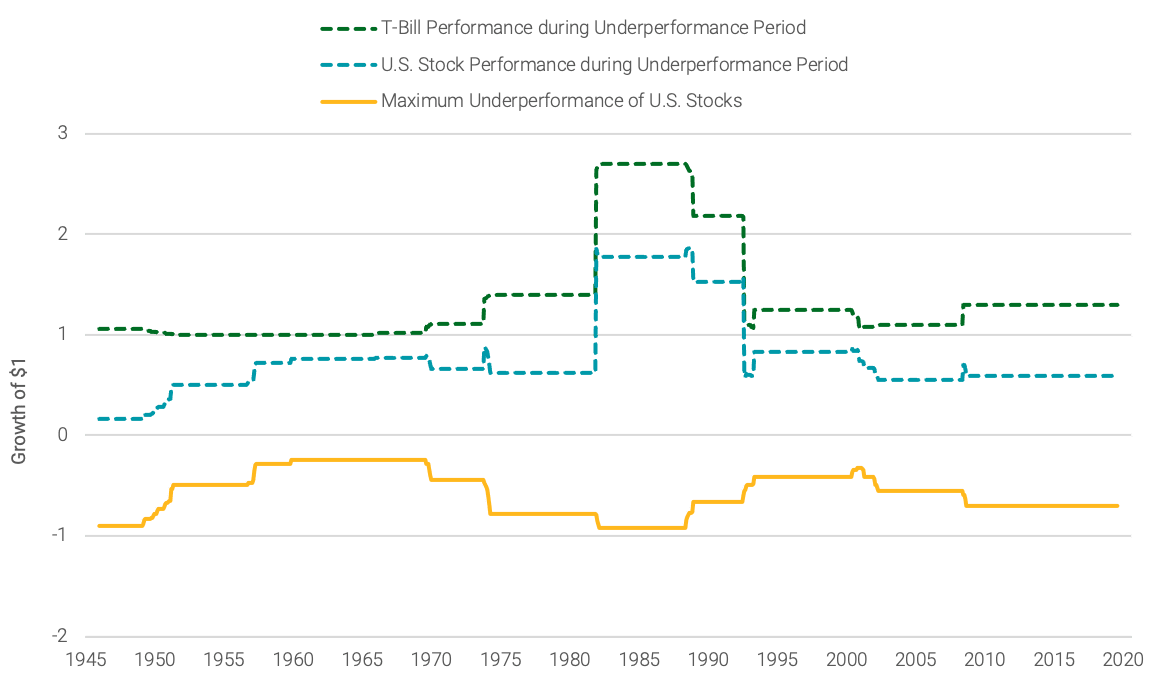
Data for both figures from 6/1946-1/2020. Source: Ken French Data Library.
As shown in Figure 2a, during the 20-year period from December 1994 to December 2014, $1 invested in U.S. equities grew to $6.71 while that same dollar invested in Treasury bills became $1.69. During this 20-year period, there was a subperiod from April 2000 to February 2009 when $1 invested in the market became $0.59 while $1 invested in one-month T-bills grew to $1.29, an underperformance of $0.70. A dollar invested in the market in December 1994 grew to $3.52 in March 2003, but subsequently dropped 41% in value to $2.01 before reaching $6.71 in December 2014.
The outperformance investors enjoyed in each 20-year period also came with subperiods of pain (underperformance). In some cases, these subperiods were long with significant underperformance. The yellow line in Figure 2a highlights the worst cumulative underperformance subperiod of U.S. equities versus T-bills within each 20-year rolling period. These subperiods of sometimes terrifying market performance happened at different times—early, in the middle or near the finish of the full 20-year window, but in the end the market delivered for equity investors in each long-term period. Figure 2b magnifies the scale of underperformance to highlight its significance, while Figure 2a shows it in the same scale as the 20-year cumulative rolling performance data to put the underperformance in context with the overall return.
Over every 20-year period going back to the initial 1926-1946 period, challenging subperiods might have tempted investors to divest from the higher expected return asset class to buy Treasury bills instead. These types of risks (which entire generations can face) are likely to significantly test an investor’s resolve in equity markets. Over all these 20-year periods (almost 900 overlapping periods total), remaining disciplined and focusing on long-term outcomes translated to earning a premium over T-bills.
Small-Cap Value vs. U.S. Equities
We also wanted to test the small-cap value premium over the market to identify the challenges investors in this asset class have faced historically. Figure 3a shows the long-term performance of small value versus the U.S. equity market. Many investors embrace small value in their search for higher expected returns beyond the overall equity market.
During every 20-year period from 1926-1946 until January 2020, small value delivered a premium relative to the U.S. market. But just like we saw in U.S. equities versus T-bills, within any of those 20-year periods, challenging subperiods tested an investor’s conviction to stay in the asset class.
FIGURE 3A | ROLLING 20-YEAR GROWTH OF SMALL-CAP VALUE STOCKS VS. U.S. STOCKS
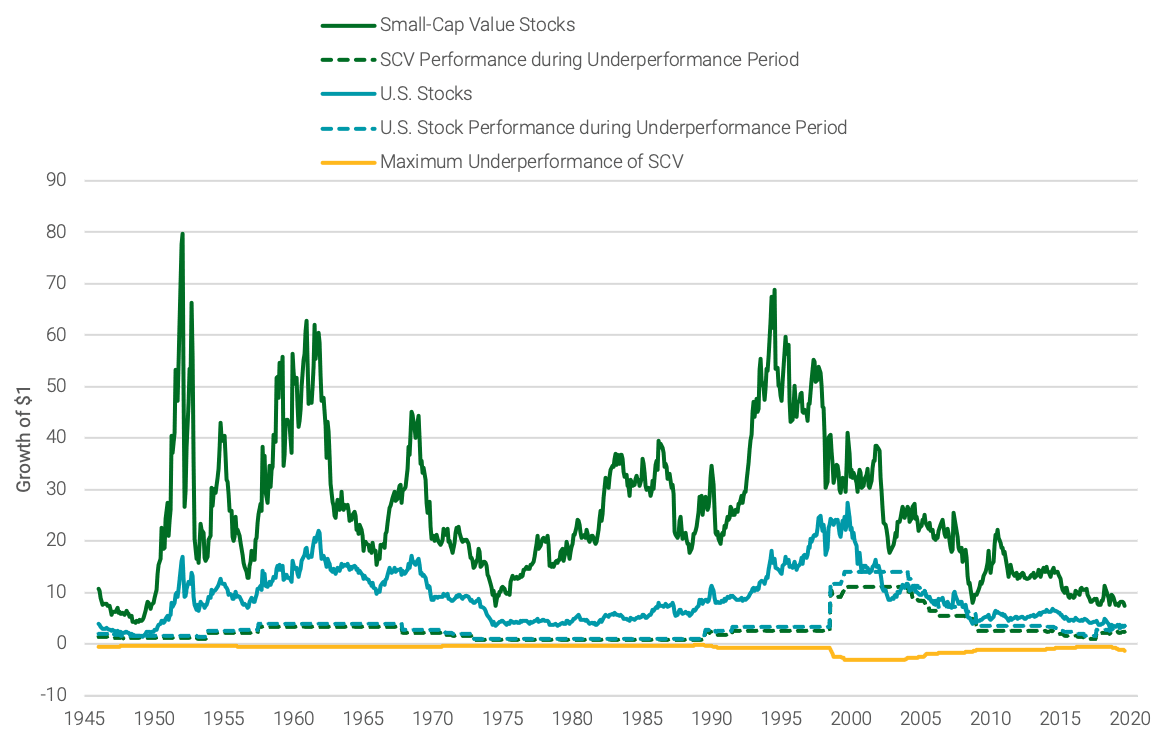
FIGURE 3B | MAXIMUM UNDERPERFORMANCE OF SMALL-CAP VALUE STOCKS VS. U.S. STOCKS IN SUBPERIODS
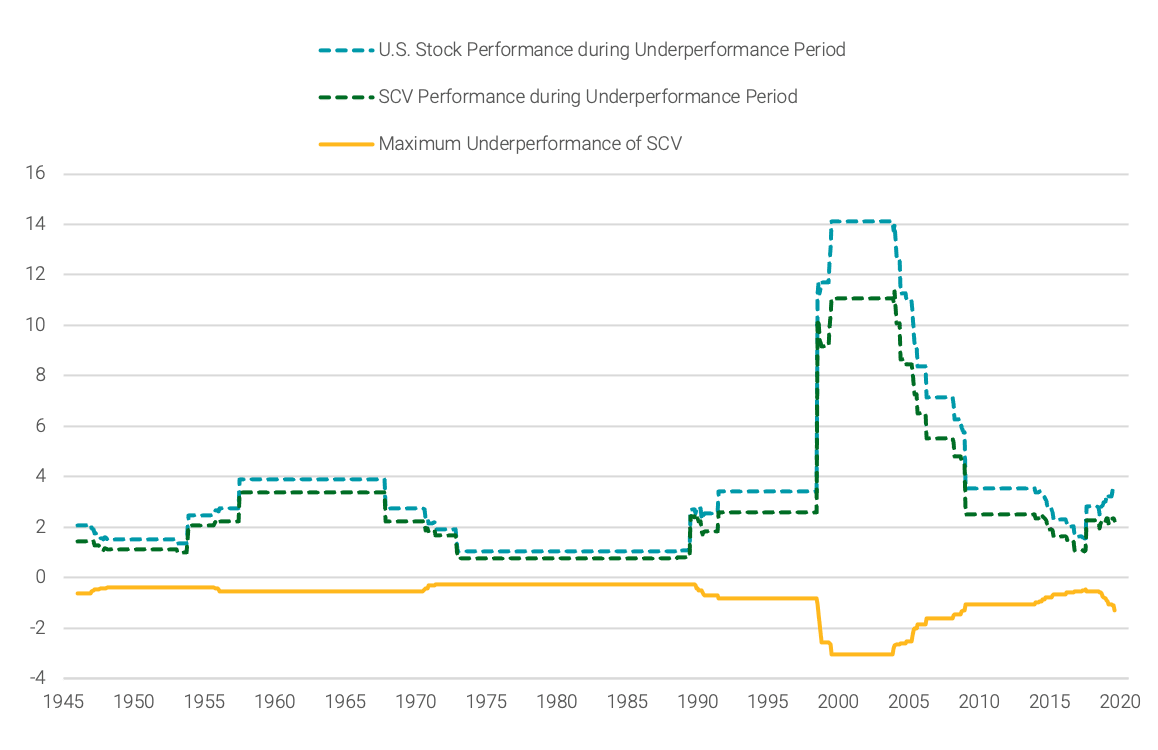
Small-cap value stocks are represented by the Small Value Portfolio from Ken French Data Library. Data for both figures from 6/1946-1/2020. Source: Ken French Data Library.
As shown in Figure 3a, during the 20-year period from December 1981 to December 2001, $1 invested in small value grew to $34.23 (green line) while $1 invested in the U.S. stock market resulted in $14.97 (light blue line). Small value cumulatively underperformed the market by 303% in a subperiod from June 1984 to December 1999, as shown in Figure 3b. During this subperiod, $1 invested in small value became $11.08 while $1 invested in the market grew to $14.10.
While these subperiods would have been painful for small value investors, there was a long-term reward. The small value premiums observed in the market came with uncertainty with which investors would had to have coped to see their desired results.
While past performance isn’t an indication of future performance, it can help us understand the risks and the rockiness of the path that we may face when deciding to invest in higher expected return assets. When reviewing a 20-year period (a relatively short investment window for many retirement savers), the uncertainty eventually evened out. But actually living through each of these periods and confronting questions like “Is this time different?” and “Can things get better?” would have been challenging. We believe a deep faith in markets and a good asset allocation would have helped and should continue to help enormously in the future.
ENDNOTES
¹Meir Statman, Finance for Normal People: How Markets and Investors Behave, (Oxford: Oxford University Press, 2017).
²Ulrike Malmendier and Stefan Nagel, “Depression Babies: Do Macroeconomic Experiences Affect Risk Taking?” Quarterly Journal of Economics 126, no. 1 (February 2011): 373-416.
³Adam Eric Greenberg and Hal Hershfield, “Financial decision making,” Consumer Psychology Review 2, no. 1 (January 2019): 17-29.
*Expected Returns - Valuation theory shows that the expected return of a stock is a function of its current price, its book equity (assets minus liabilities) and expected future profits, and that the expected return of a bond is a function of its current yield and its expected capital appreciation (depreciation). We use information in current market prices and company financials to identify differences in expected returns among securities, seeking to overweight securities with higher expected returns based on this current market information. Actual returns may be different than expected returns, and there is no guarantee that the strategy will be successful.
Past performance is no guarantee of future results.
Our philosophy is based on the idea that paying less for an expected stream of cash flows or the equity of a company should produce higher expected returns. Our systematic, repeatable and cost-efficient process uniquely designed for Avantis Investors is actively implemented to deliver diversified portfolios expected to harness those higher expected returns.
This material has been prepared for educational purposes only. It is not intended to provide, and should not be relied upon for, investment, accounting, legal or tax advice.
The opinions expressed are those of the investment portfolio team and are no guarantee of the future performance of any Avantis Investors portfolio. This information is not intended as a personalized recommendation or fiduciary advice and should not be relied upon for investment, accounting, legal or tax advice. References to specific securities are for illustrative purposes only and are not intended as recommendations to purchase or sell securities.
Investment return and principal value of security investments will fluctuate. The value at the time of redemption may be more or less than the original cost. Past performance is no guarantee of future results.
The contents of this Avantis Investors presentation are protected by applicable copyright and trade laws. No permission is granted to copy, redistribute, modify, post or frame any text, graphics, images, trademarks, designs or logos.
FOR FINANCIAL PROFESSIONAL USE ONLY/NOT FOR DISTRIBUTION TO THE PUBLIC