Volatility Lessons: Should We Expect More Market Declines?
The S&P 500® Index recently completed its worst 100-day run to start a year since 1970 — one of many signs of a volatile market that has stressed investors. With continued concerns related to inflation’s impact on consumer spending and company earnings, potential effects from the Federal Reserve’s (Fed’s) rate hikes, and the oft-cited possibility in the media that this could all lead to recession, we are left wondering if more market declines are to come.
No one knows for sure, but we can look to the past for perspective. So, with the goal of offering some calm in times that are anything but, we’ve drawn on the long history of the U.S. stock market.
We examine how the market has performed after prior periods of decline like we’ve seen through the first 100 trading days of 2022. We also consider the performance of stocks during economic recessions.
Our findings remind us of many other volatile periods and economic contractions. Still, historically those investors who have managed to stay in the market through the tough times have been rewarded for bearing that risk.
Do Sharp Market Declines Tend to Be Followed by More Declines?
We should remember that volatility is a normal and expected part of investing. When prices go down, the market is doing its job, incorporating investors’ future expectations and discount rates based on current information and anxiety. If we think about the news investors have faced in 2022, it’s unsurprising that markets have priced companies lower.
Here’s why. Theory tells us that a reduction in company price should come from one or a combination of two things:
The market expects the company to deliver lower profits than before.
The market demands higher expected returns to bear the uncertainty of an investment.
We very well could be seeing a combination of both.
The market prices the uncertainty of the day such that there is a continued expected premium for holding stocks. If there were no risk, there would be no expected premium, and the growth delivered by markets over the long term would not have been realized.
While helpful reminders, theory and historical experience may not fully ease the anxiety many investors face today. Investors often look for signs in the market to tell us if the tide is turning or if more of the past is to come, so we examine one possible signal. Does a period of quick market decline predict more market losses to follow?
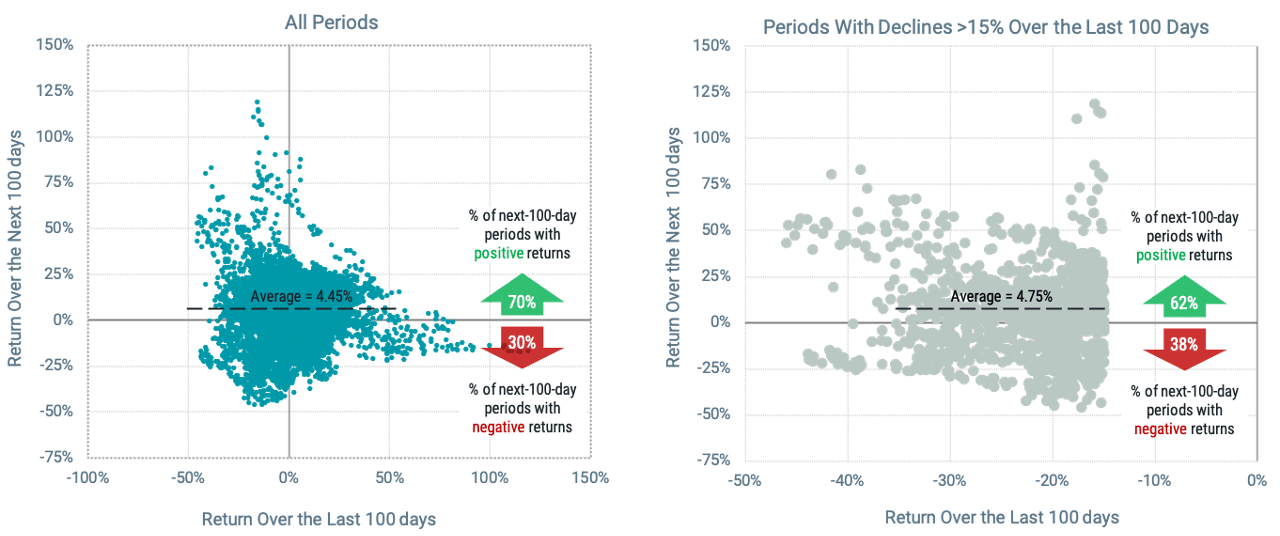
We set up our experiment by looking at the relation between the performance of U.S. stocks over the past 100 days versus the next 100 days. Essentially, this is a simple test of whether there is continuation in broad stock market returns. We start by looking at the relation across all periods in the market going back to July 1926.
We plot the results in the left panel of Figure 1. The observations form a cloud with no discernable pattern, telling us that recent returns don’t seem to inform short-run returns in the future. The key finding is that 70% of the next-100-day return periods were positive. So, regardless of what happened over the prior 100 days, positive returns followed over the next 100 days far more often than not, and stocks delivered a return of 4.45% on average, similar to the historical market average across all days of 1% per month.
Figure 1 | U.S. Stock Market Returns Since 1926: Last 100 Days vs. Next 100 Days

Data from 7/1/1926 – 4/30/2022. The market is represented by the CRSP U.S. Total Market Index. Source: Avantis Investors. Past performance is no guarantee of future results.
What about periods following sharper declines, as we saw over the first 100 trading days of 2022? In the right panel of Figure 1, we narrow our sample to last-100-day return periods of -15% or worse. Again, we see no clear relation. Sometimes the next 100 days were positive and sometimes negative. At 62% positive, the percentage of positive next- 100-day return periods is lower than the 70% we see over all periods, but there’s still a meaningful gap between positive and negative observations. Further, the average return is slightly higher at 4.75% versus 4.45% despite fewer positive periods.
There’s no evidence that sharp declines over the past 100 trading days are more often followed by further declines. And, with nearly 100 years of market history showing that those next 100 days tend to be positive, investors should think twice about abandoning stocks now in an attemptto time a market bottom.
What if the Economy Slips Into a Recession?
Calls of an impending recession among various media outlets have been common over the past several weeks. With the Fed’s plan to curb inflation through an aggressive series of rate hikes and balance sheet cuts, including the first half-percentage point rate increase since 2000, many have questioned whether the Fed can bring inflation back down to its target while still navigating a “soft landing” for the economy.
Continued global supply chain challenges and their effects on commodity prices might make the job even more difficult for the Fed (e.g., current port congestion in China and rising shipment delays, as well as the baby formula shortage driven, in part, by the lack of Ukrainian sunflower oil following Russia’s invasion of Ukraine).
One might wonder if the outcomes we saw in the prior study might be different if the economy enters a period of contraction. Figure 2 shows the average monthly return of U.S. stocks during all months, months of contraction (recessions) and months of expansion as defined by the National Bureau of Economic Research (NBER) from the start of the first recession in the last 50 years (December 1973) through the end of the last recession (April 2020).
Primary takeaways include:
The economy has largely been expanding over the period (about 87% of the time).
During periods of recession, the market’s average monthly return has been significantly lower than the average monthly return over the full period.
Figure 2 | Average U.S. Stock Market Returns During the 7 Full Business Cycles of the Past 50 Years

U.S. business cycle expansions and contraction data from the National Bureau of Economic Research. Returns data from 12/1/1973 – 4/30/2020. Dates are based on the beginning of the first full business cycle of the last 50 years, December 1973 and conclusion of the last full business cycle of the period in April 2020. The CRSP U.S. Total Market Index represents the market. Source: National Bureau of Economic Research, Avantis Investors. Past performance is no guarantee of future results.
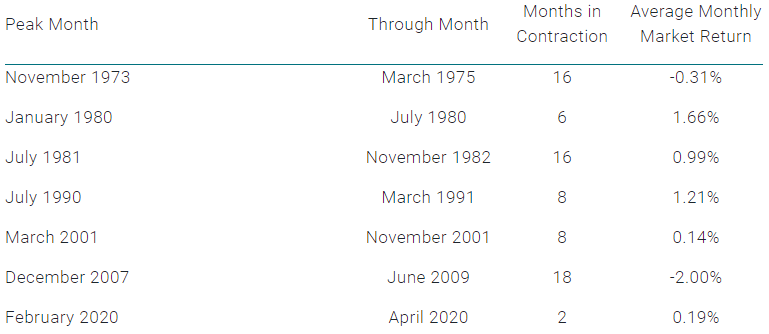
If we dig into the seven recessions over the past 50 years, we see more to the story. Figure 3 shows the average monthly market return during each recession.
Of the seven periods, the market produced a positive return in five of them. During two periods, the average market return was higher than the average monthly return over the full sample period shown in Figure 2. The meaningfully negative returns during the Great Financial Crisis bring down the overall average during recessions.
This tells us that market returns are not necessarily negative during periods of market contraction. We find that most market losses happen early in the recession period and asset classes with high valuations tend to suffer more than others.
Figure 3 | U.S. Stock Market Returns Have Been Positive During Most Recessions of the Last 50 Years

U.S. business cycle expansions and contraction data from the National Bureau of Economic Research. Returns data from 12/1/1973 – 4/30/2020. Dates are based on the beginning of the first full business cycle of the last 50 years, December 1973 and conclusion of the last full business cycle of the period in April 2020. The CRSP U.S. Total Market Index represents the market. Source: National Bureau of Economic Research, Avantis Investors. Past performance is no guarantee of future results.
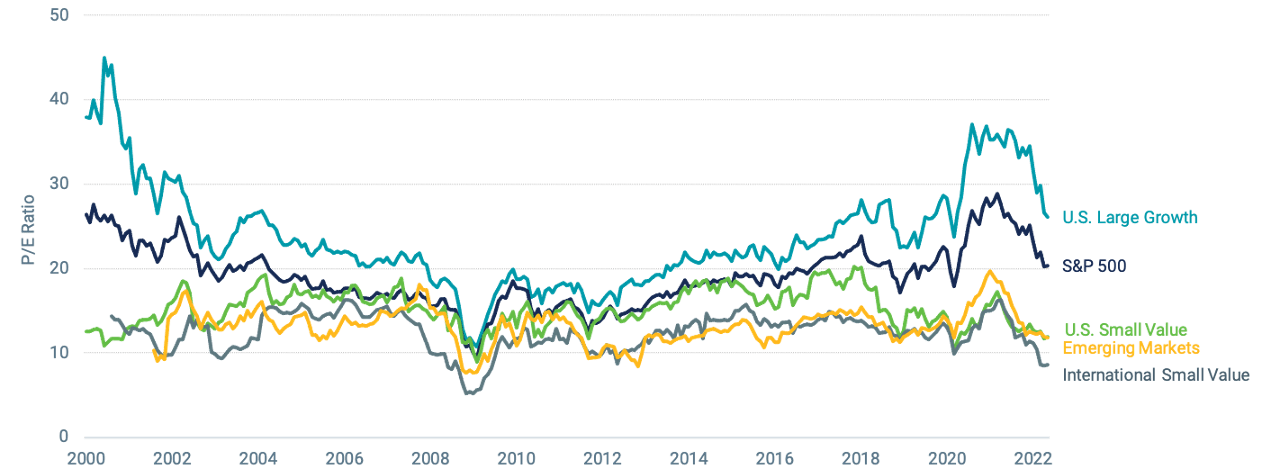
Figure 4 highlights historical valuations for select asset classes. Notably, the spread between valuations of U.S. large growth and small value stocks remains wide compared to what we've seen over much of the past 20 years.
If we think about how markets work and how recessions are determined, the returns of stocks during periods of contraction should not be surprising. Markets are forward-looking, so if the market is anticipating an economic slowdown, the effects and the probability of these effects should already be reflected in prices.
Recessions themselves are also identified after the fact by the NBER. This private nonprofit assesses many economic indicators and metrics, including, but not limited to, gross domestic product (GDP) growth, to see if the economy is slowing for an extended period before a recession is identified.
That means we could already be in a recession that will be identified later — we do have one quarter of negative GDP growth in the books. It could also be that we won’t reach the NBER’s criteria for a recession any time soon. Recession or no recession, what matters is that prices are already capturing this risk based on the information we have today.
Figure 4 | Historical Valuation Ratios for Select Asset Classes

Data from 1/1/2000 – 5/1/2022. Source: Morningstar/Bloomberg. The Russell 1000® Growth Index represents U.S. Large Growth, U.S. Small Value is the Russell 2000® Value Index, International Small Value is the MSCI EAFA Small Value Index, and Emerging Markets is the MSCI Emerging Markets Index. Past performance is no guarantee of future results
The Resiliency of Markets
It’s been quite a bumpy ride for investors in 2022. Understanding why volatility is normal and how markets have performed during similar periods in the past can help calm the anxiety we may feel during these times.
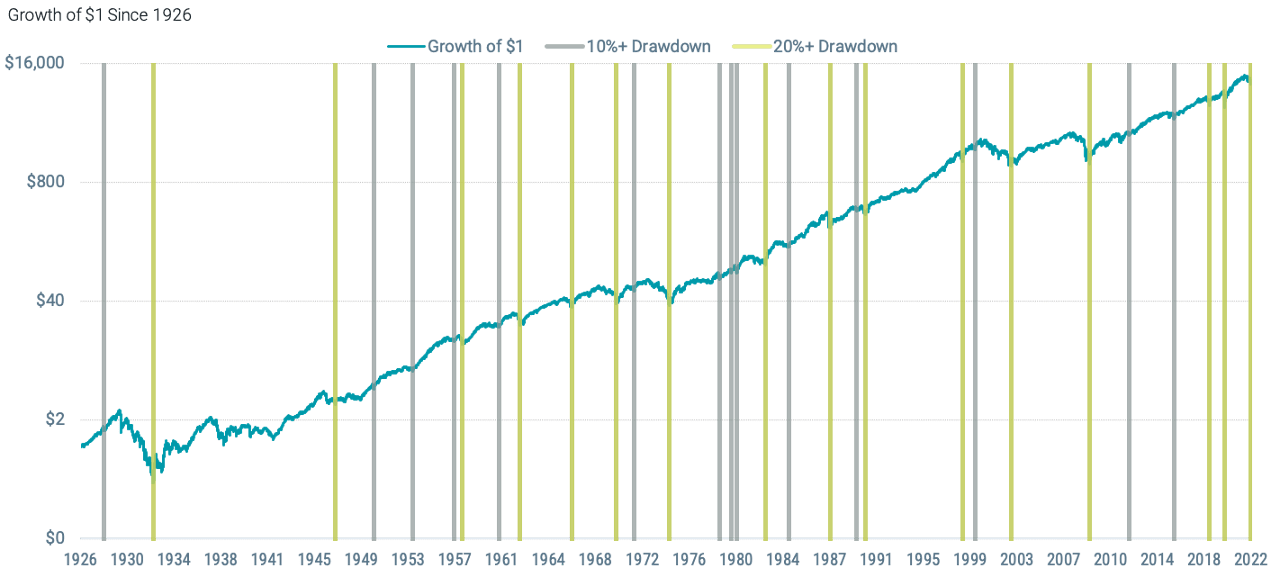
But the resiliency we’ve seen from markets over time is likely the most helpful takeaway. Figure 5 shows the long-term growth of a dollar from 1926 through countless market corrections. This reminds us that while it’s normal to have anxiety about uncertain times, keeping our focus on the long term may help quell fears about the volatility of the day.
Figure 5 | The U.S. Stock Market Has Climbed Despite Numerous Corrections

U.S. business cycle expansions and contraction data from the National Bureau of Economic Research. Returns data from 7/1/1926 – 5/26/2022. The CRSP U.S. Total Market Index represents the market. Source: Avantis Investors. Past performance is no guarantee of future results.
Glossary
CRSP U.S. Total Market Index: Consists of nearly 4,000 constituents across mega, large, small and micro capitalizations, representing nearly 100% of the U.S. investable equity market.
Gross Domestic Product (or GDP): A measure of the total economic output in goods and services for an economy.
Russell 1000® Growth Index: Measures the performance of those Russell 1000 Index companies (the 1,000 largest publicly traded U.S. companies, based on total market capitalization) with higher price-to-book ratios and higher forecasted growth values.
Russell 2000® Value Index: Measures the performance of those Russell 2000 Index companies (the 2,000 smallest of the 3,000 largest publicly traded U.S. companies, based on total market capitalization) with lower price-to-book ratios and lower forecasted growth values.
S&P 500® Index: A market-capitalization-weighted index of the 500 largest U.S. publicly traded companies. The index is widely regarded as the best gauge of large-cap U.S. equities.
This material has been prepared for educational purposes only. It is not intended to provide, and should not be relied upon for, investment, accounting, legal or tax advice. Investment return and principal value of security investments will fluctuate. The value at the time of redemption may be more or less than the original cost. Past performance is no guarantee of future results.
Diversification does not assure a profit nor does it protect against loss of principal.
It is not possible to invest directly in an index.