Uncovering True Value in Search of Higher Expected Returns
Current Prices Contain Information
Let’s pretend you’re approached with an offer to buy a company. How would you determine how much it is worth? If you were going to submit a bid and you needed to value the company, there’s a simple framework you can use as a starting point.
At a minimum, your bid would need to cover:
Current Equity. You would at least have to pay for the value of the equity (assets minus liabilities) the company holds—for example, the value of its buildings minus any mortgages.
Discounted Future Profits. Since the company is an ongoing concern, it performs business activities to generate profits. You would have to pay for those profits, too, but at a discounted price (a dollar of profits in the future isn’t the same as a dollar today).
We can summarize this into a simple equation:

You can estimate the equity and the profits and propose a discount rate that reflects your views on the risks inherent in the cash flows to calculate a price. There will probably be negotiations about the discount rate until you and the seller agree on a price to strike a deal.
This same process happens all the time in the stock market between many different buyers and sellers of each listed company. Buyers and sellers transact in the market by agreeing on a price for each company each time shares are traded. When they agree on a price what they are essentially doing is estimating or implying a discount rate. The price of a company can be affected by new information about the company, its competitors, its clients and prospects, its vendors (and the vendors of the vendors, and the vendors of the competitors), prices of its products and any price pressure it may be facing, markets in which the company does business or could potentially do business, new lines of business the company could introduce, the economy, taxation, etc. Because the flow of this vast amount of information is so continuous and fluid, prices change often with buyers and sellers agreeing on updated consensus prices and so, too, updated consensus discount rates.
Why does this matter? Because we can use this information in an effort to design strategies with potentially higher expected returns.*
Differences in Discount Rates
As market participants incorporate information into each company’s price, that price and company financials can be used to find differences in discount rates across companies. We are interested in those discount rates because those discount rates represent our expected returns (i.e., what we expect to earn by investing our capital, although nothing is ever guaranteed). Why are discount rates equivalent to expected returns? You can think about the relationship as similar to how the coupon payment or yield for an investor on a bond is the interest expense or interest rate charged to the company.
At this point, you may be asking, “So you invest in companies without doing a bunch of stock-specific research or meeting with the company management?” The short answer is yes. We’re able to leverage the work of millions of people who spend countless hours and a lot of money researching companies. Prices incorporate the aggregate view of all these active investors together and we use the information the prices contain in an effort to benefit the portfolios. Think about the last time you were looking for a new place to eat. Did you spend a bunch of time visiting five or six different restaurants to see how clean they were, how the food looked coming out of the kitchens, and whether the service seemed good? Or did you open a restaurant rating app to leverage the experiences of thousands of other diners? Using market prices to discern differences in discount rates embraces the same concept.
Not all companies have the same discount rate. The market imposes different discount rates on companies because different companies have different risks, opportunities, competition, clienteles, etc. By using market prices, together with financial information, it’s possible to find groups of companies that have higher discount rates (aka expected returns) than others. Let’s go back to our valuation equation:

This equation has three variables (price, equity and profits) linked to discount rates. So, if we create two ratios—Equity/Price and Profits/Equity—we can see that companies with
High Equity/Price and High Profits/Equity should have High Discount Rates.
Low Equity/Price and Low Profits/Equity should have Low Discount Rates.
Let’s examine some cases to demonstrate the logic:
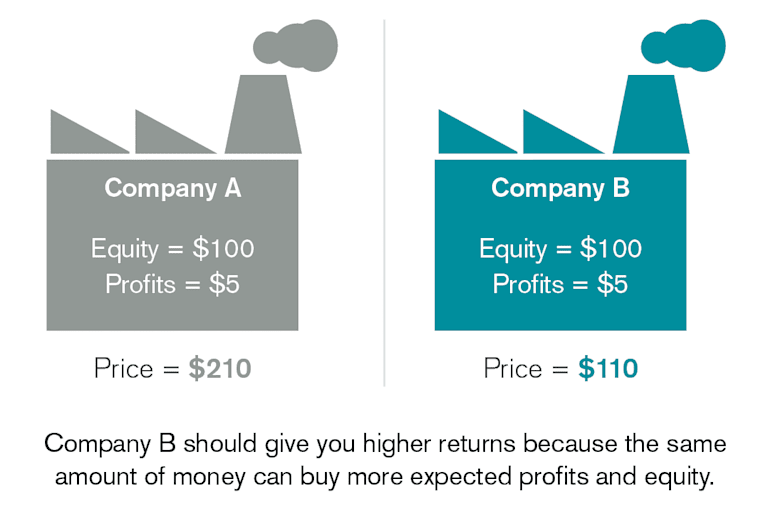
Case 1: Same Equity and Same Profits but Different Prices
Imagine you have two companies with the same amount of equity and the same level of profits, but Company A is trading at a higher price than Company B. Which one do you think would give you higher expected returns? Company A where you are paying more or Company B where you are paying less for the same profits and equity?
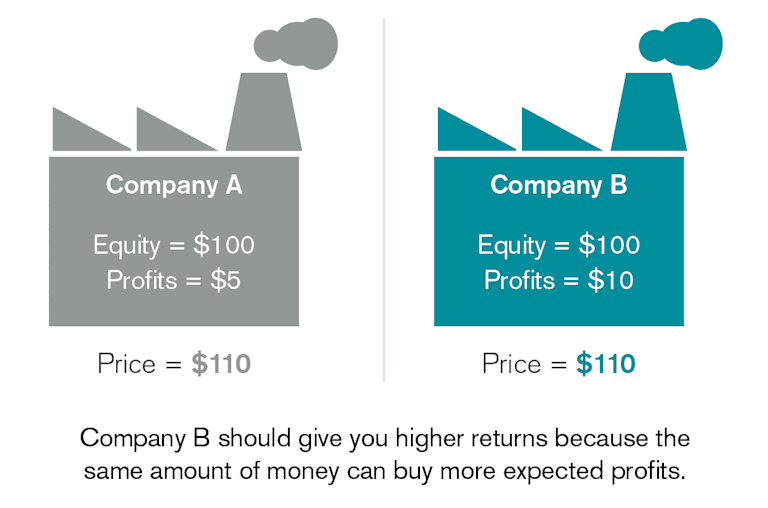
Case 2: Same Equity and Same Prices but Different Profits
Imagine you have two companies with the same amount of equity and trading at the same price, but Company B has higher profits than Company A. Which one do you think would give you higher expected returns? Company B (which is giving you more expected profits) or Company A (which is giving you fewer expected profits)?
Case 3: Same Profits and Same Prices but Different Equity
Imagine you have two companies with the same amount of profits and trading at the same price, but Company B has higher equity than Company A. Which one do you think would give you higher expected returns? Company B (which is giving you more equity) or Company A (which is giving you less equity)?
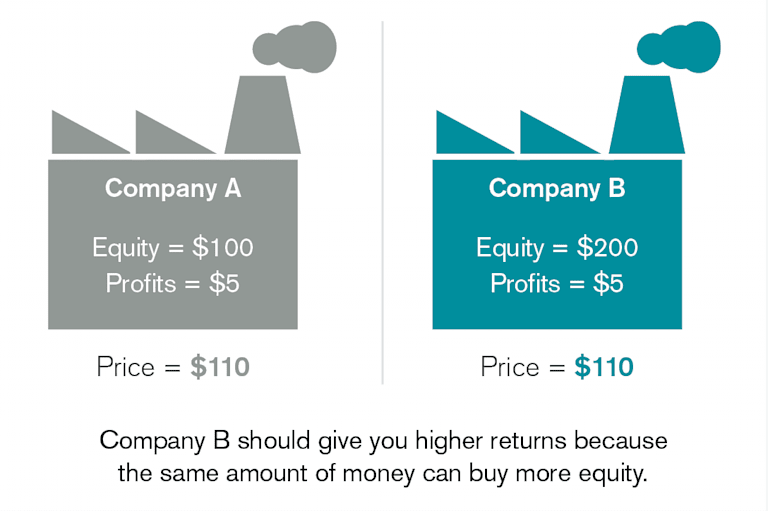
As you can see, what you’re doing is trying to select companies that could give you higher equity and higher profits at lower prices, or more value for your investment, and therefore higher expected returns.
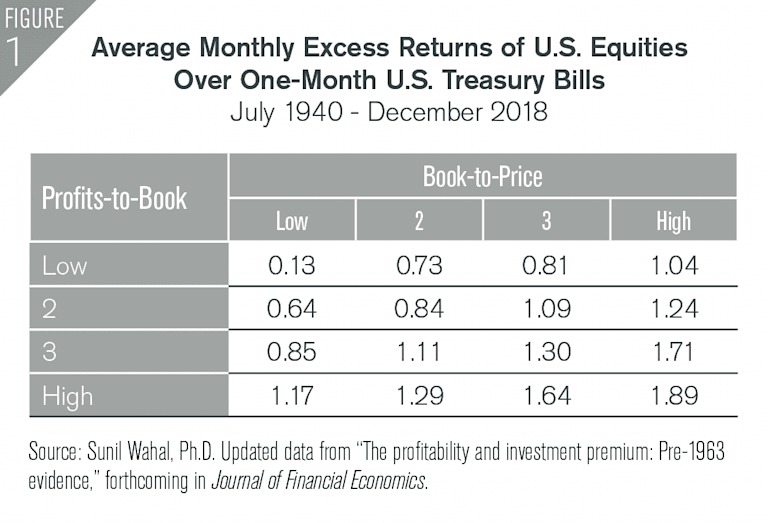
Large sets of historical data are used to corroborate the theoretical implications described above. Figure 1 shows the average monthly returns of companies sorted by Book-to-Price (similar to Profits-to-Book). These observations show that companies with high Book-to-Price and high Profits-to-Book had higher historical returns than companies with low Book-to-Price and low Profits-to-Book.
Companies with high levels of fundamentals per dollar in price, i.e., high Book-to-Price, have historically been called “value companies.” The idea behind these companies is that you’re spending less money for the equity of the company than that of a “growth” company and that’s why you get higher expected returns. Growth stocks are those that have high prices relative to fundamentals. Sometimes growth stocks are also called “glamour” stocks.
Profits-to-Book is called profitability and it’s a way to get a more complete view of the value of each company to better pinpoint which companies should have higher expected returns. Using profitability and Book-to-Price together as we did in our first example is more comprehensive because you’re considering what the company has today and what it’s expected to generate in the future to assess its value. Understanding true value is a combination of what you pay and what you get.
Spreading Risks Across Many Companies
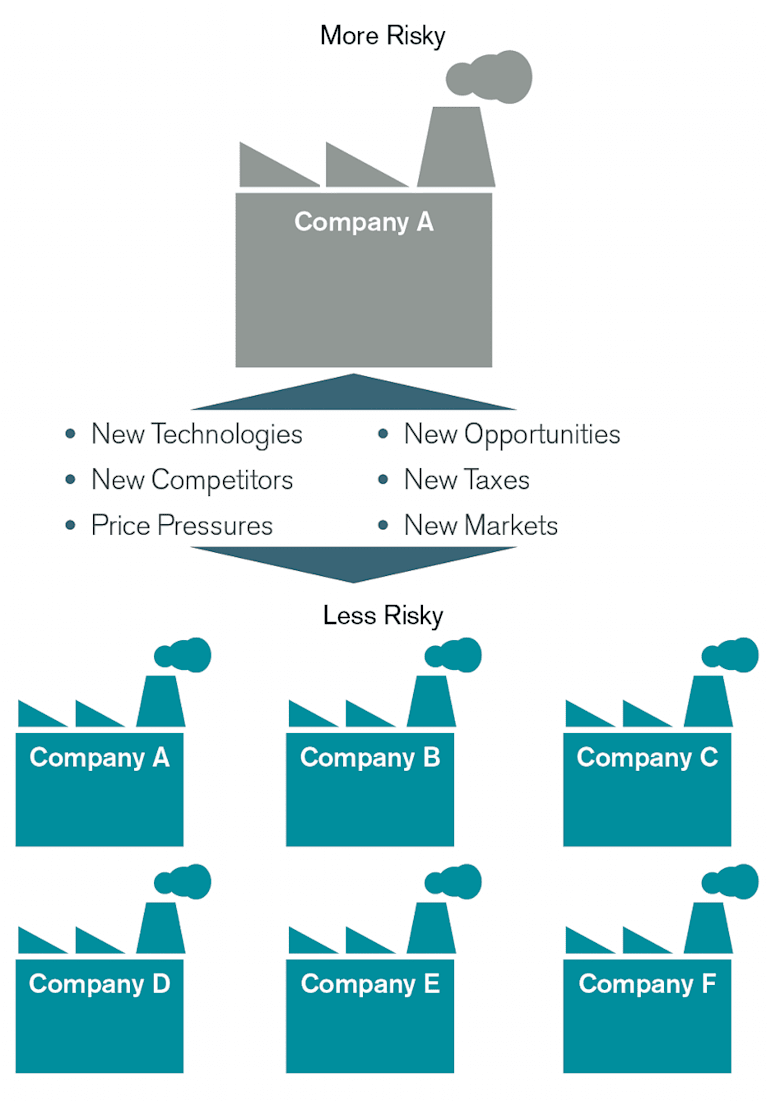
As we’ve discussed, there’s so much information that can affect the price of each company that we believe it makes sense to diversify portfolios across many companies, industries, countries, etc. This valuation framework applies to all companies regardless of industry or location. A process based on market prices and financial information permits broad diversification, something that active stock picking may restrict.
Broad diversification helps minimize the risks that new and unexpected information may negatively affect the overall portfolio in a significant way. Having smaller allocations spread across many companies, instead of a concentrated portfolio of just a few companies, is a way to mitigate the risk exposure to any new piece of negative information about any single company you hold.
Should I Invest Only in Value or Higher-Expected-Return Stocks?
There isn’t a single right answer to this question because it will likely depend on your preferences. You can hold a diversified portfolio of value stocks, but we know from historical observations that there have been periods where growth companies outperformed value companies. So, it may be prudent to consider an even more diversified portfolio that includes different kinds of stocks.
Relative to their weight in the market, overweighting higher-expected-return stocks (stocks with high profitability and high Book-to-Market, particularly in small caps) could help increase the expected returns of the overall portfolio. Any overweighting of higher-expected-return stocks comes from underweighting growth stocks with lower expected returns. In our view, there’s no need to fully exclude those lower-expected-return stocks in an asset allocation focused on higher-than-market-expected returns. Higher-expected-return stocks can be overweighted by underweighting lower-expected-return stocks to different degrees, potentially enhancing returns and still enjoying the benefits of diversification than those that growth stocks bring to the asset allocation.
Working with your financial advisor, you can develop and monitor your long-term investment plan by incorporating customized risk tolerances and adjustments to goals on an ongoing basis.
*Expected returns: Valuation theory shows that the expected return of a stock is a function of its current price, its book equity (assets minus liabilities) and expected future profits, and that the expected return of a bond is a function of its current yield and its expected capital appreciation (depreciation). We use information in current market prices and company financials to identify differences in expected returns among securities, seeking to overweight securities with higher expected returns based on this current market information. Actual returns may be different than expected returns, and there is no guarantee that the strategy will be successful.
GLOSSARY
Book-to-Price. Compares a company’s book value relative to its market capitalization. Book value is generally a firm’s reported assets minus its liabilities on its balance sheet. A firm’s market capitalization is calculated by taking its share price and multiplying it by the number of shares that it has outstanding.
Fundamentals. Fundamentals are typically factors used to determine value that are more economic (growth, interest rates, inflation, employment) and/or financial (income, expenses, assets, credit quality) in nature. In contrast, “technical” factors are based more on market price (into which fundamental factors have been “priced in”), trend and volume factors (supply and demand), and momentum. Technical factors can often override fundamentals in near-term investor and market behavior, but investments with strong fundamental supports should theoretically maintain their value and perform relatively well over long periods.
Profits-to-Book. Used to measure a company’s profitability relative to its book value. A company’s profitability is generally calculated by subtracting operating expenses from its gross profit. Book value is generally a firm’s reported assets minus its liabilities on its balance sheet.
U.S. Treasury securities. Debt securities issued by the U.S. Treasury and backed by the direct “full faith and credit” pledge of the U.S. government. Treasury securities include bills (maturing in one year or less), notes (maturing in 2-10 years) and bonds (maturing in more than 10 years). They are generally considered among the highest quality and most liquid securities in the world.
Yield. For bonds and other fixed-income securities, yield is a rate of return on those securities. There are several types of yields and yield calculations. “Yield to maturity” is a common calculation for fixed-income securities, which takes into account total annual interest price, redemption value and the amount of time remaining until maturity.
Our philosophy is based on the idea that paying less for an expected stream of cash flows or the equity of a company should produce higher expected returns. Our systematic, repeatable and cost-efficient process uniquely designed for Avantis Investors is actively implemented to deliver diversified portfolios expected to harness those higher expected returns.
This material has been prepared for educational purposes only. It is not intended to provide, and should not be relied upon for, investment, accounting, legal or tax advice.
The opinions expressed are those of the investment portfolio team and are no guarantee of the future performance of any Avantis Investors portfolio. This information is not intended as a personalized recommendation or fiduciary advice and should not be relied upon for investment, accounting, legal or tax advice. References to specific securities are for illustrative purposes only and are not intended as recommendations to purchase or sell securities.
Investment return and principal value of security investments will fluctuate. The value at the time of redemption may be more or less than the original cost. Past performance is no guarantee of future results.
Diversification does not assure a profit, nor does it protect against loss of principal.
The contents of this Avantis Investors presentation are protected by applicable copyright and trade laws. No permission is granted to copy, redistribute, modify, post or frame any text, graphics, images, trademarks, designs or logos.