Think Big Picture When It Comes to Elections
Key Takeaways
With election uncertainty often comes increased market volatility, but this typically subsides after the election.
Historical market performance has varied widely around elections but has on average been positive regardless of which political party has been victorious.
Market timing based on elections is risky and unlikely to outperform a consistent investment strategy.
While much of the circumstances surrounding presidential elections change from election to election (and indeed, the 2024 cycle has been exceptional in many ways), some things never change. With increasing certainty about the major party candidates, the quadrennial debates have begun on who will take the White House and what a victory for either party could mean for the stock market.
Less than 100 days until the election in November, we’ve seen a significant sell off and heightened volatility so far in August. In the coming weeks and months, election-related headlines will likely offer investors plenty more potential questions about their portfolios. However, the reality is that much more impacts market returns over time than which political party controls the Oval Office.
Allowing election-driven anxiety to lead you astray from your long-term financial plan may result in more harm than good. To demonstrate, we offer context on how markets have behaved historically around elections and, just as importantly, highlight why investors should be careful about inferring too much from past results (or other theories they hear in the news) as they form their expectations for the future.
How Does Uncertainty Around Elections Affect Market Volatility?
Let’s start with a fundamental question: What is it about election cycles that stokes investors' fears? Heightened uncertainty likely plays a role. When uncertainty rises in the market, it can lead to higher volatility. So, while investors may care if markets have tended to go up or down before and after elections and what might drive these outcomes, we also wanted to understand if historical volatility near elections offers any useful insights.
We computed average levels of the VIX Index, a well-known measure of implied market volatility taken from S&P 500® Index option prices, for each of the three months preceding a general election month (August through October), during each election month (November) and each of the three months after the election month (December through February).
Data for the VIX begins in 1990, providing a small sample size (eight elections) but enough data to determine whether markets have tended to behave in line with our intuition over recent periods.
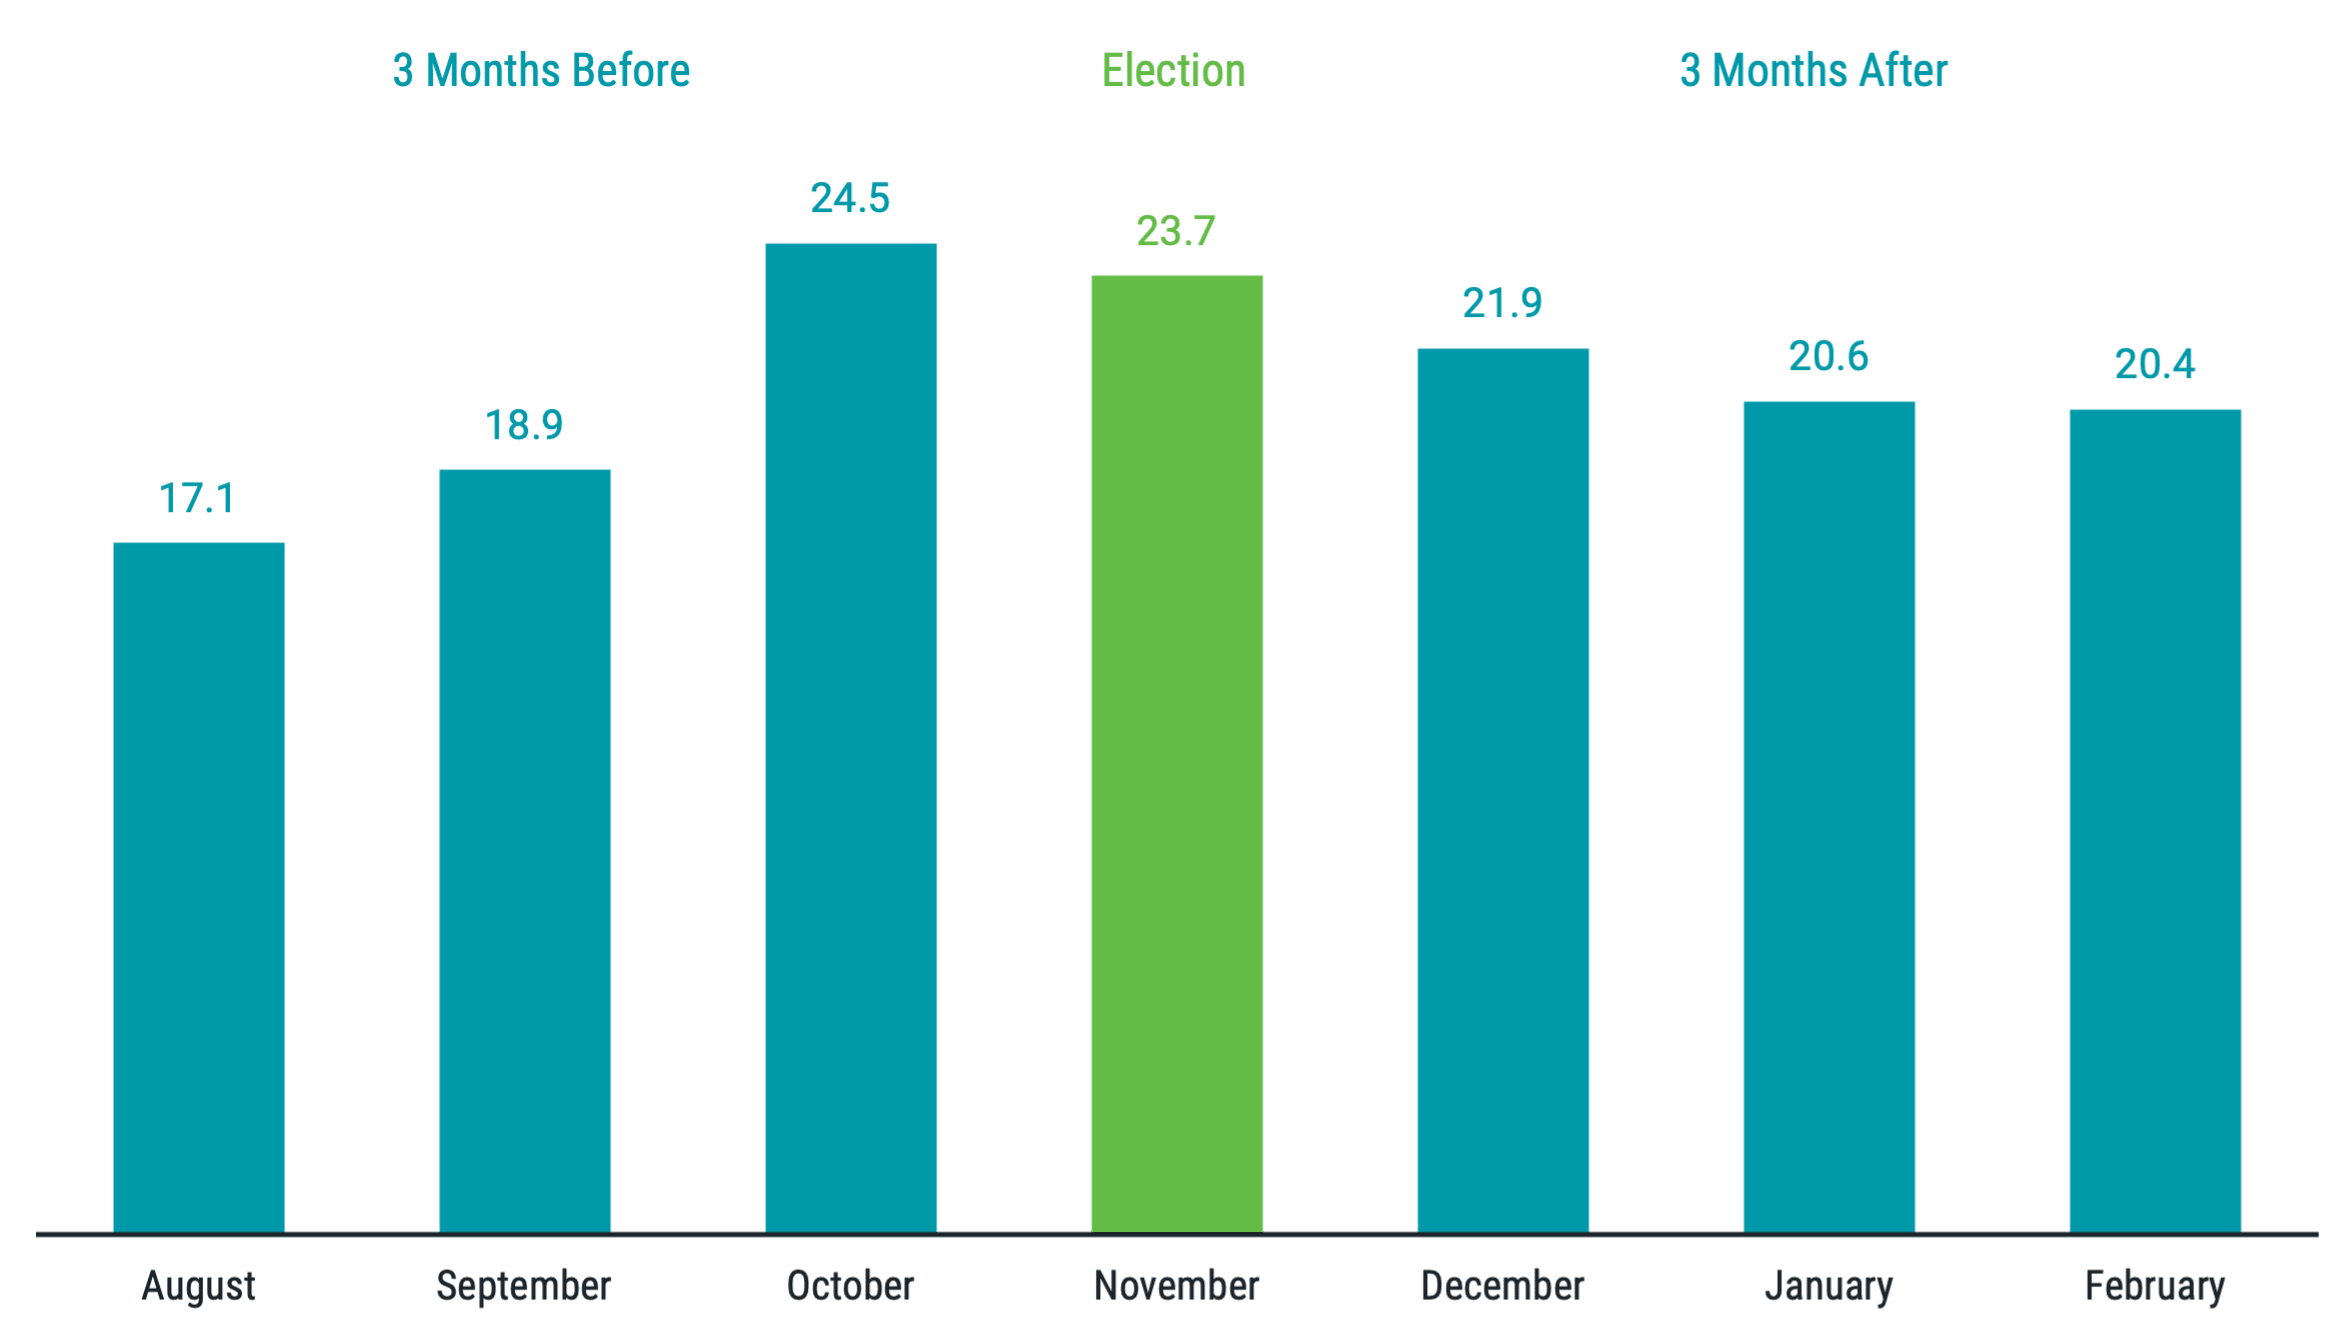
In Figure 1, we present the summary results. What we find across these elections, beginning with George H. W. Bush's 1992 victory and ending with Joe Biden's latest triumph in 2020, is that, on average, volatility has risen leading up to the election month (when uncertainty around the election outcome may still exist) and eased moderately in the months after (when the market knows the election results).
Figure 1 | Average VIX Index Levels Before, During and After U.S. Elections From 1992 to 2020

Data from 8/1/1992 - 2/28/2021. Source: CBOE. The CBOE Volatility Index, or VIX, is a real-time market index representing the market's expectations for volatility over the coming 30 days.
Of course, the averages don’t tell us everything. Baseline volatility levels can vary quite substantially from election period to election period. For example, consider the sample group for the election month only.
The highest election-month VIX average was 62.8 in 2008, followed by 26.4 in 2000. The lowest was 13.6 in 2004. VIX levels also increased significantly in the months leading up to the 2008 election, which occurred right in the heart of the Great Financial Crisis (GFC) period — a prime example of how investors consider many other issues beyond elections in setting market prices.
However, the pattern of volatility change around elections is similar across the sample (i.e., average VIX level declines in the three months after election month for all but one of the eight elections) and removing 2008 as an outlier doesn’t change the takeaway. The useful point is understanding that election uncertainty may contribute to higher volatility, but knowing that, at least recently, it has tended to temper after the election outcome is known may be good for investors to keep in mind.
How Have Markets Performed Around Past Elections?
To examine stock market performance around elections, we have data for the U.S. stock market going back to the 1928 election won by Republican Herbert Hoover through the 2020 election (24 total elections). Again, this isn’t a very large sample size. So, while we can observe market performance around these elections, it’s also important to bear in mind the limitations of the data before concluding that historical patterns are likely to play out in the same way for future elections.
Figure 2 helps illustrate this point. These charts show market performance in election years (January through December) when a Republican versus a Democrat was elected president, as well as performance during each full four-year term starting from the month candidates were sworn in after each election (January).
Figure 2 | Average U.S. Stock Market Returns by Winning Party in Election Years and Four-Year Terms

Data from 1/1/1928 - 6/30/2024. Source: Market portfolio from the Ken French Data Library. Returns for Joe Biden’s term are through the latest available data (June 2024). Past performance is no guarantee of future results.
In the first panel, we show the full sample starting in 1928 and find that, on average, the market has performed meaningfully better in years a Republican candidate was elected versus a Democrat. On the other hand, returns during Democratic terms have been much higher than those with Republicans in office.
If we remove only the first two elections (a period that included the 1929 stock market crash and the Great Depression) and focus on the remaining 22 elections, we see the differences narrow considerably. This example shines another light on the reality that when we look at a set of data through a specific lens, significant events (or externalities) may affect market returns over time and significantly impact the results.
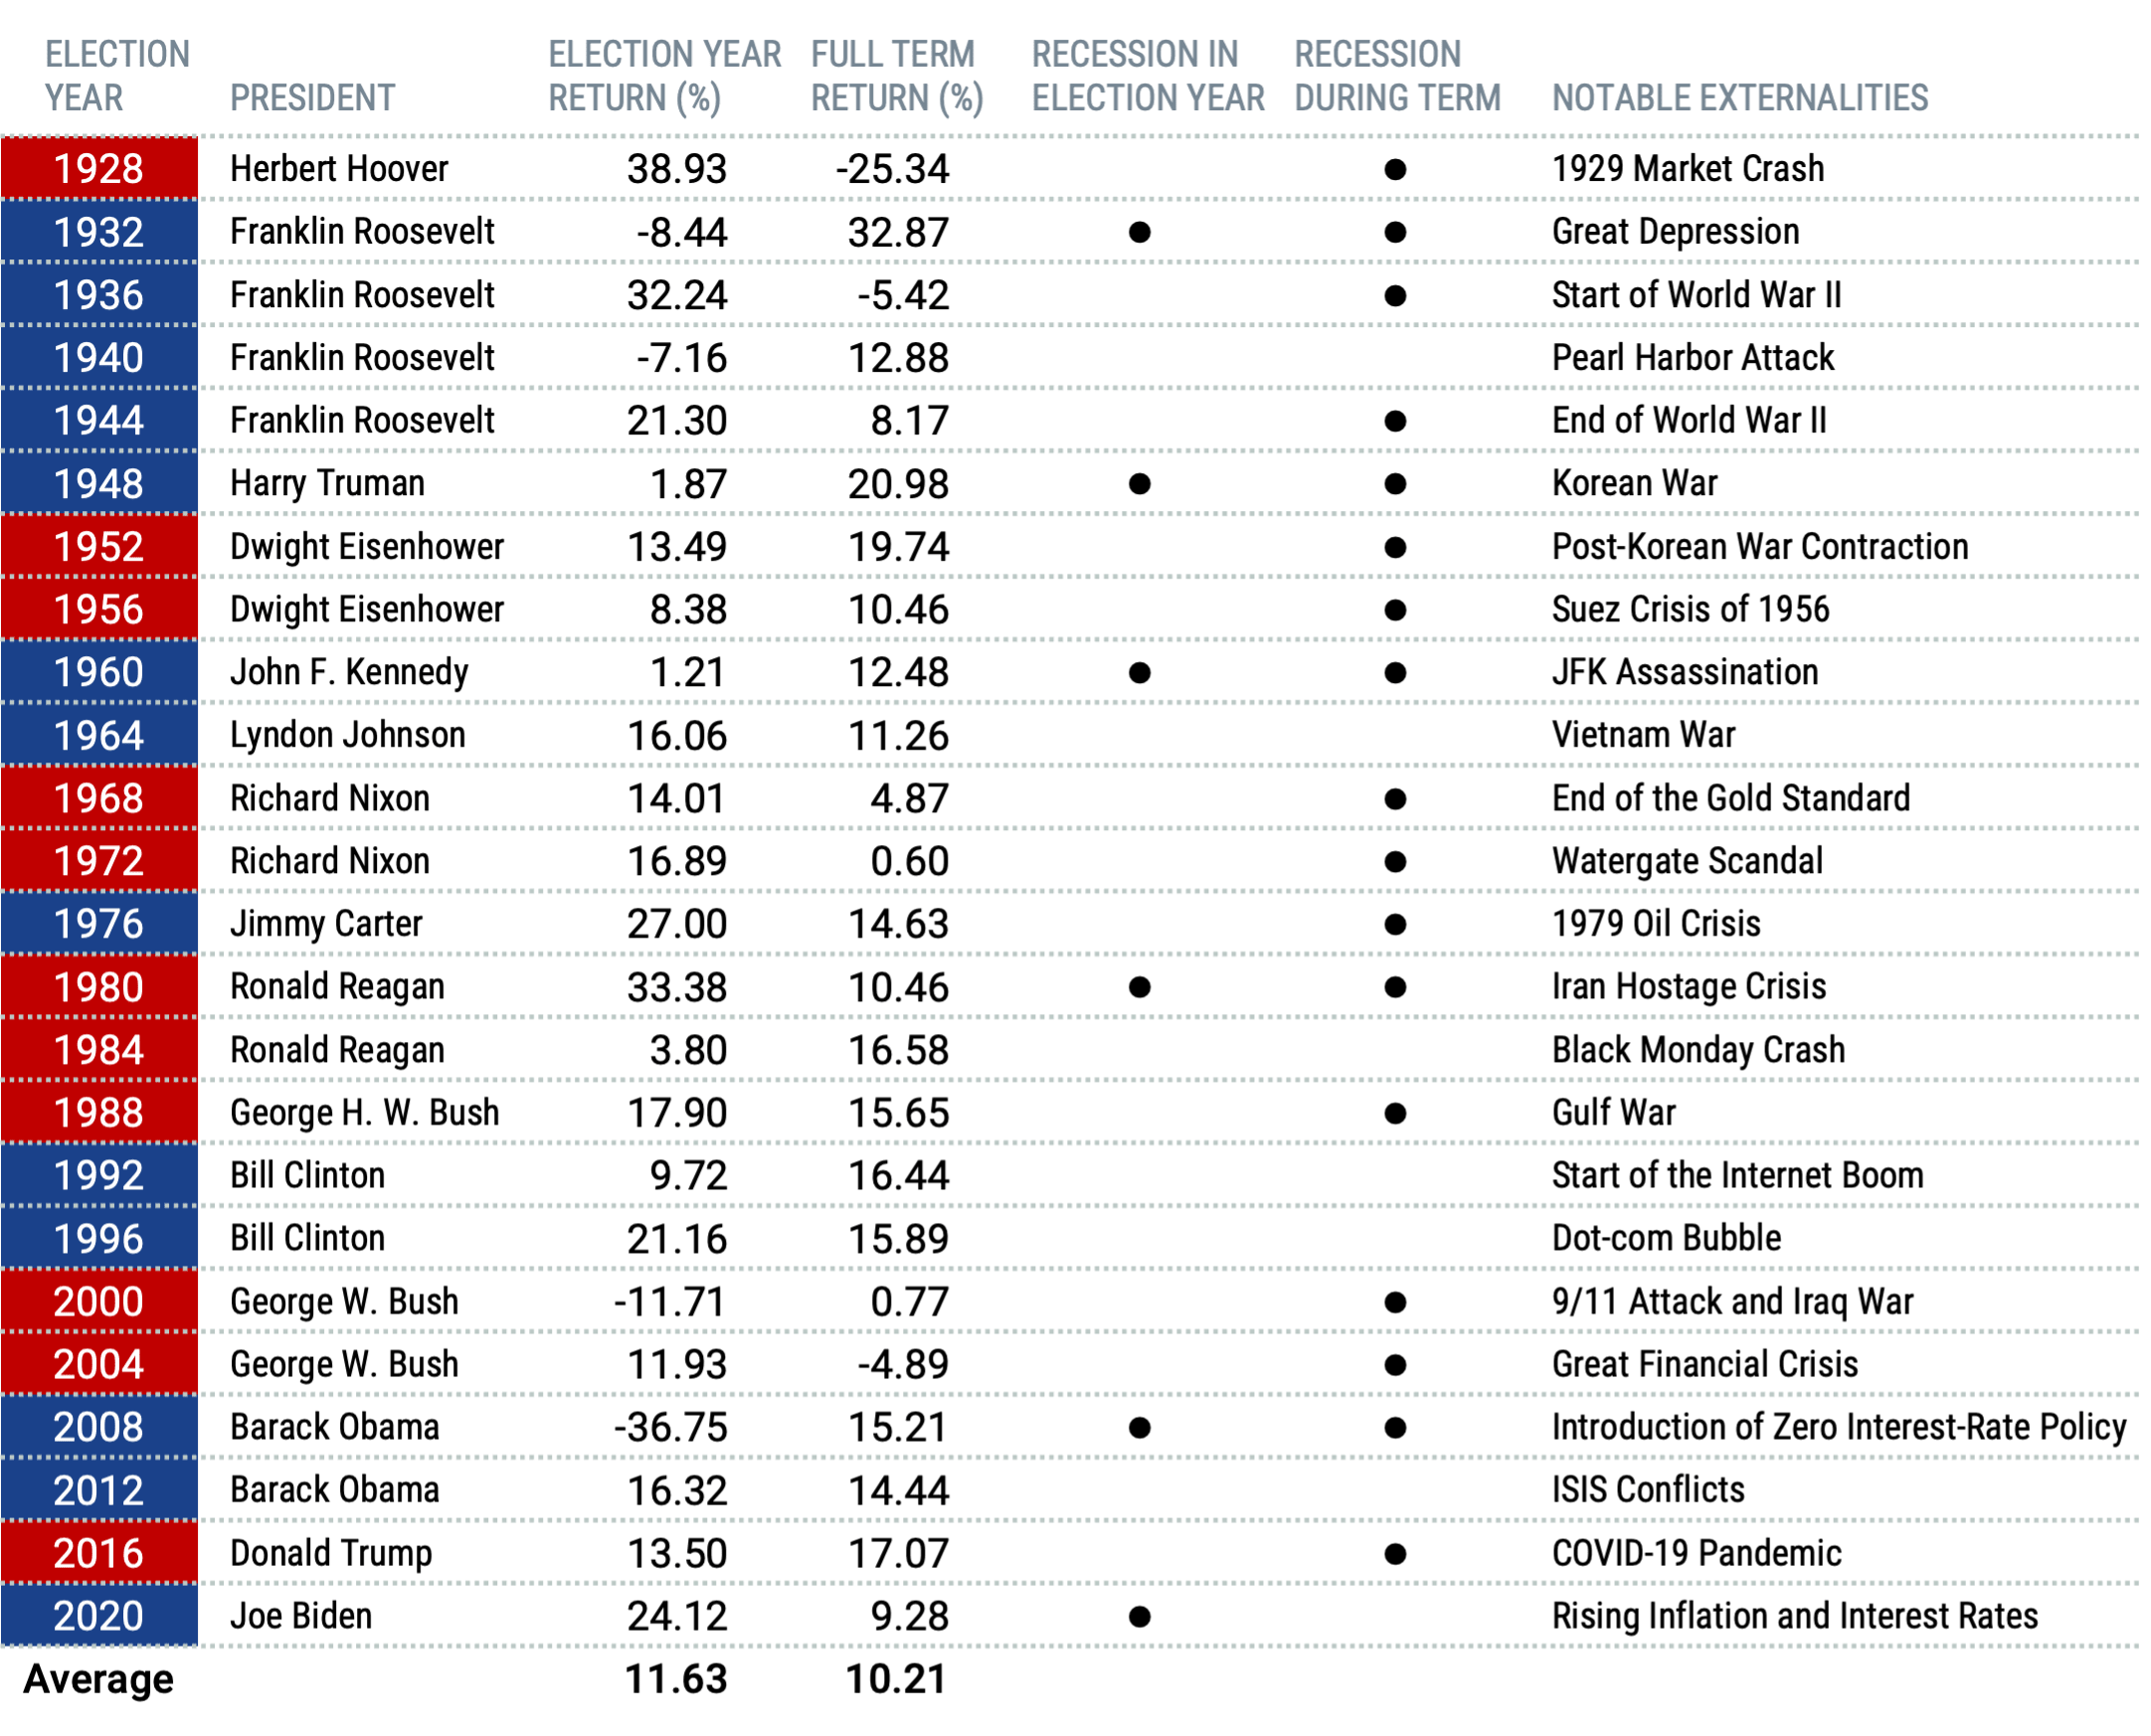
In fact, many notable events throughout history have weighed on markets and shouldn’t be ignored when assessing historical returns around elections. The table in Figure 3 shows the same data summarized in Figure 2, with the winner of each election and their party, along with examples of other significant events impacting markets during each period.
Figure 3 | Events Impacting Markets Around U.S. Presidential Elections

Data as of 1/1/1928 - 6/30/2024. Source: Market Portfolio from the Ken French Data Library. Returns for Joe Biden’s term are through the latest available data (June 2024). Past performance is no guarantee of future results.
Notably, despite the tough times that inevitably occur at different points through time, the market delivered positive returns over all presidential terms but three (after the 1928, 1936, and 2004 elections, which all coincided with major economic or geopolitical events). Only four of the 24 election years in the sample saw a market decline. Considering the many other factors facing investors in these times, it’s difficult to assign causality for how the market performed solely to the commander in chief or their party affiliation.
Why Staying the Course Around Elections Can Make a Difference
How investors choose to deploy their capital is always a matter of alternatives. While we can observe market returns in isolation, looking at what would have happened if an alternate path had been chosen may also be helpful.
For example, what if investors chose to exit stocks and move to cash when they felt anxious about election-related uncertainty? To illustrate, we computed a simple election-based timing scenario in which cash is held in election years and stocks are held in non-election years, starting the analysis in 1936, given the previously mentioned effects from the late 1920s and early 1930s.
We compare this to two alternatives: 1) remaining invested in stocks in all years in the sample and 2) remaining invested in a monthly-rebalanced portfolio of 75% stocks and 25% cash, which more closely matches the average stock exposure of our timing scenario (moving to cash every fourth year means holding stocks 75% of the time and cash the remaining 25%).
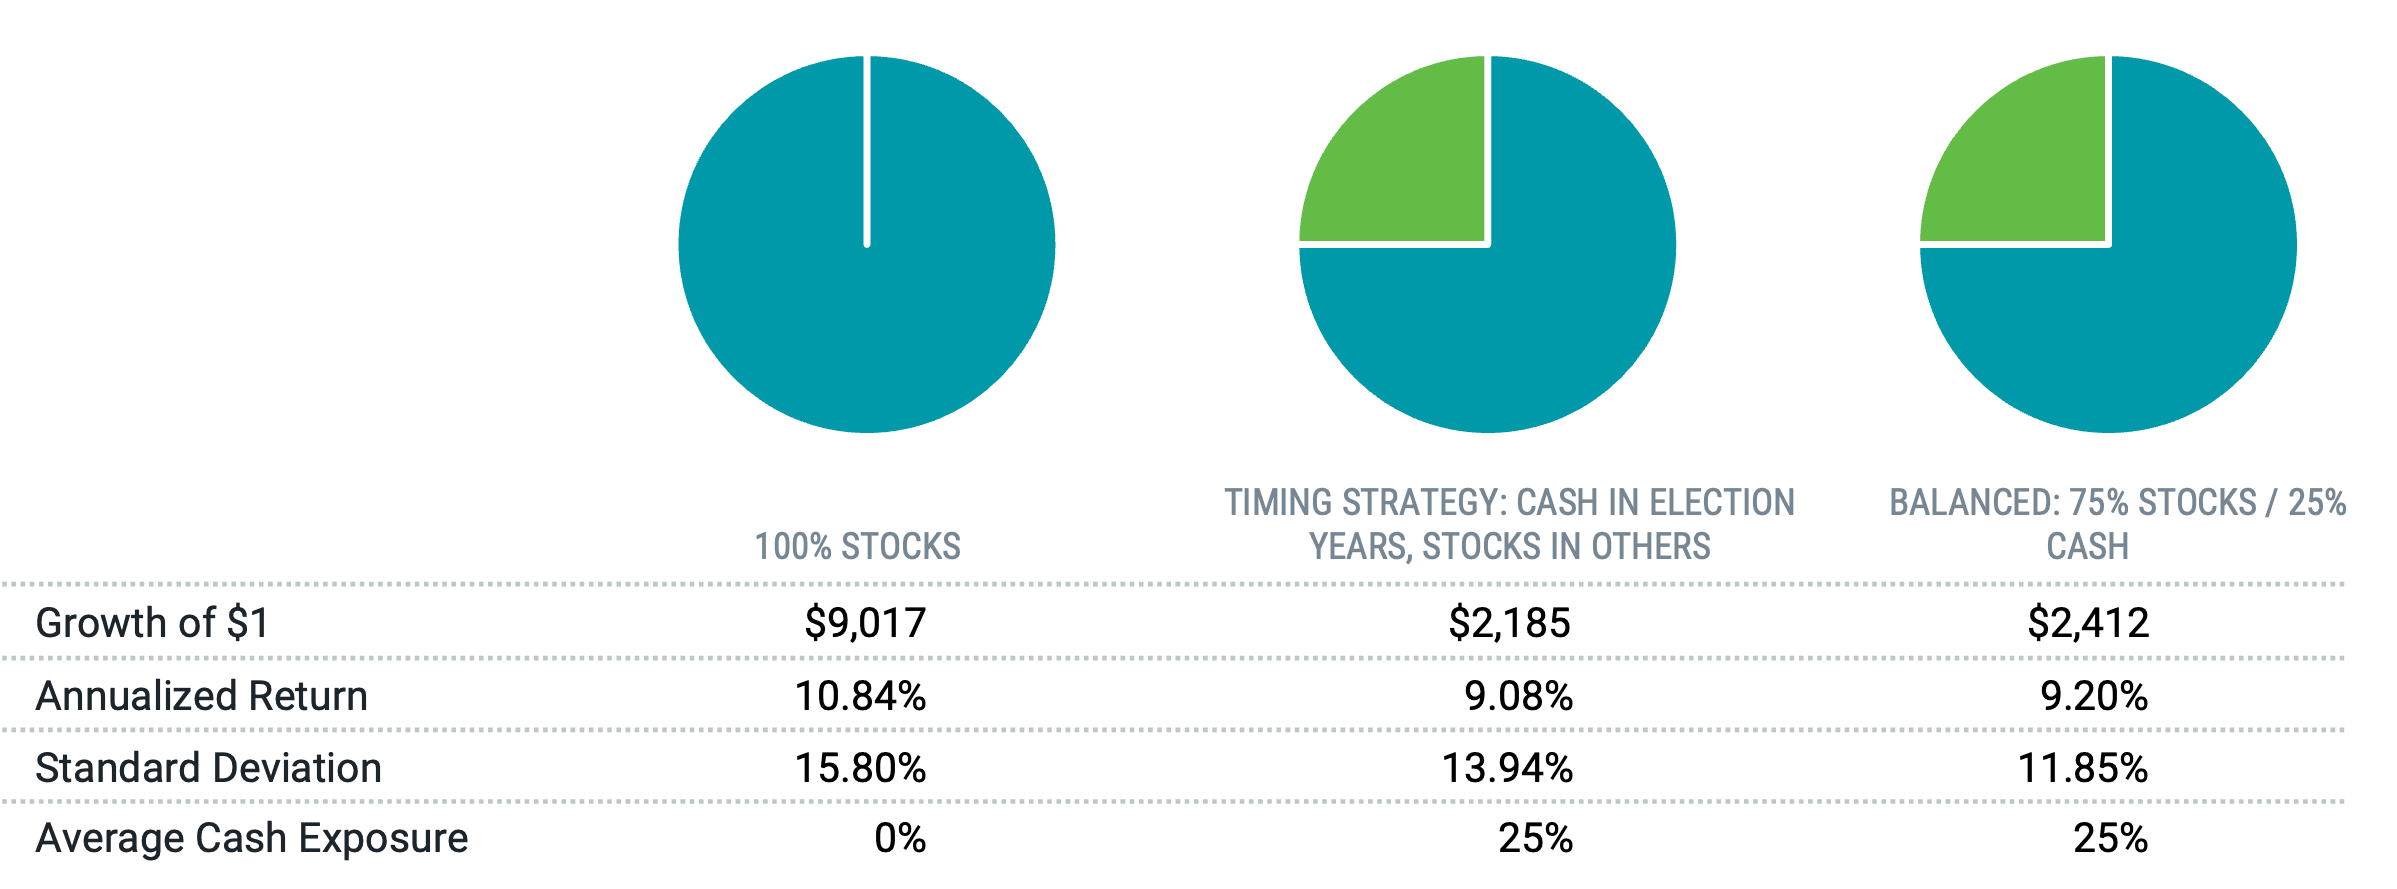
Figure 4 illustrates the results. The higher annualized return for the 100%-stock scenario versus the timing strategy shouldn’t be surprising. We’ve already demonstrated that, on average, stocks have delivered strong returns in election years despite the potentially higher volatility and uncertainty that may drive some investors to the sidelines.
Figure 4 | Despite Election Noise, Sticking With Your Financial Plan May Pay Off

Data from 1/1/1936 - 6/30/2024. Source: Market portfolio and cash (risk-free rate) returns from the Ken French Data Library. Past performance is no guarantee of future results. This hypothetical situation contains assumptions that are intended for illustrative purposes only and are not representative of the performance of any security. There is no assurance similar results can be achieved, and this information should not be relied upon as a specific recommendation to buy or sell securities.
The difference in the long-term growth of a dollar highlights how impactful long-term compounding in the market can be. However, the story here is more about risk exposure rather than differences in returns due to election years themselves or different administrations.
The comparison of the timing strategy to the balanced strategy with 75% stocks and 25% cash helps bring this to life. We observe relatively similar annualized returns and growth levels between the two (albeit marginally higher for the balanced, non-timing scenario). The real difference is in the volatility outcomes, with the constant allocation to stocks and cash providing a more than 2% reduction in standard deviation.
The balanced allocation maintained consistently through time delivered similar returns and better risk management. If timing had a benefit, it should have delivered higher returns or reduced risk, and we got neither. So, while we may feel anxious about elections, panicking and attempting to time the market does not add value.
Bringing it All Together
Here’s the bottom line. Markets may experience heightened volatility leading up to elections, but that tends to pass, so we shouldn’t let that scare us from sticking with our portfolios. While the proposed policies of different candidates and political parties can undoubtedly impact the economy and markets, investors are considering and assigning probabilities to many other considerations and externalities that get reflected in market prices.
We shouldn’t put too much stock in how markets have historically fared under one political party or another. There’s just not enough data or reliable evidence suggesting that investors can benefit from timing markets around elections. Instead, we believe investors are likely better off focusing on the big picture and understanding that uncertainty can come from many places — not just elections.
Glossary
Chicago Board of Trade (CBOE) Volatility Indexes: Volatility indexes are forward-looking measures of the market's expectations of volatility (or how much a stock index's price moves). The CBOE manages and publishes three of the most widely used volatility indexes based on three major stock indexes: The VIX Index tracks the expected 30-day future volatility of the S&P 500 Index, the VXN Index tracks the expected 30-day future volatility of the NASDAQ-100 Index and the VXD Index tracks the expected 30-day future volatility of the Dow Jones Industrial Average Index. VIX, VXN and VXD are the ticker symbols for these three volatility indexes. The VIX in particular is a widely used measure of market risk and is often referred to as the "investor fear gauge."
S&P 500® Index: A market-capitalization-weighted index of the 500 largest U.S. publicly traded companies. The index is widely regarded as the best gauge of large-cap U.S. equities.
Standard deviation: Standard deviation is a statistical measurement of variations from the average. In financial literature, it’s often used to measure risk when risk is measured or defined in terms of volatility. In general, more risk means more volatility and more volatility means a higher standard deviation — there’s more variation from the average of the data being measured.
Investment return and principal value of security investments will fluctuate. The value at the time of redemption may be more or less than the original cost. Past performance is no guarantee of future results.
This material has been prepared for educational purposes only. It is not intended to provide, and should not be relied upon for, investment, accounting, legal or tax advice.
The opinions expressed are those of the portfolio team and are no guarantee of the future performance of any Avantis fund.