
Then and Now: An Update on Today’s Bond Market
Think back to this time last year. Inflation was soaring to a 40-year high of 9.1%. The Federal Reserve (Fed) had just made its third-consecutive rate hike, raising the federal funds rate by 0.75% for the first time in more than 25 years. The S&P 500® Index was down just shy of 20% — the index’s worst 6-month start to a year since 1970.
At the same time, the U.S. bond market, measured by the Bloomberg U.S. Aggregate Bond Index, was down more than 10%. Calls for an impending recession were a dime a dozen. Put simply, these were tough times for many investors’ portfolios.
Oh, how times have changed. The market and economic statistics in Figure 1 help paint the picture. The stock and bond markets have turned around. Inflation has cooled. Some inflation measures using 12-month averages may even overstate current inflation given the rate of price increases have been coming down recently. An estimate of annualized inflation based on the most recent quarter from the Federal Reserve Bank of Cleveland puts current Consumer Price Index (CPI) at 3%, nearing the Fed’s 2% target. Economic growth also appears strong. And while the Fed has been clear that more rate hikes may come this year, there are many signs that the period of rising rates, or at least significantly rising rates, may be ending.
So, what are bond investors to make of this? We offer a few considerations for allocating to bonds in today’s market.
Figure 1 | How Times Have Changed
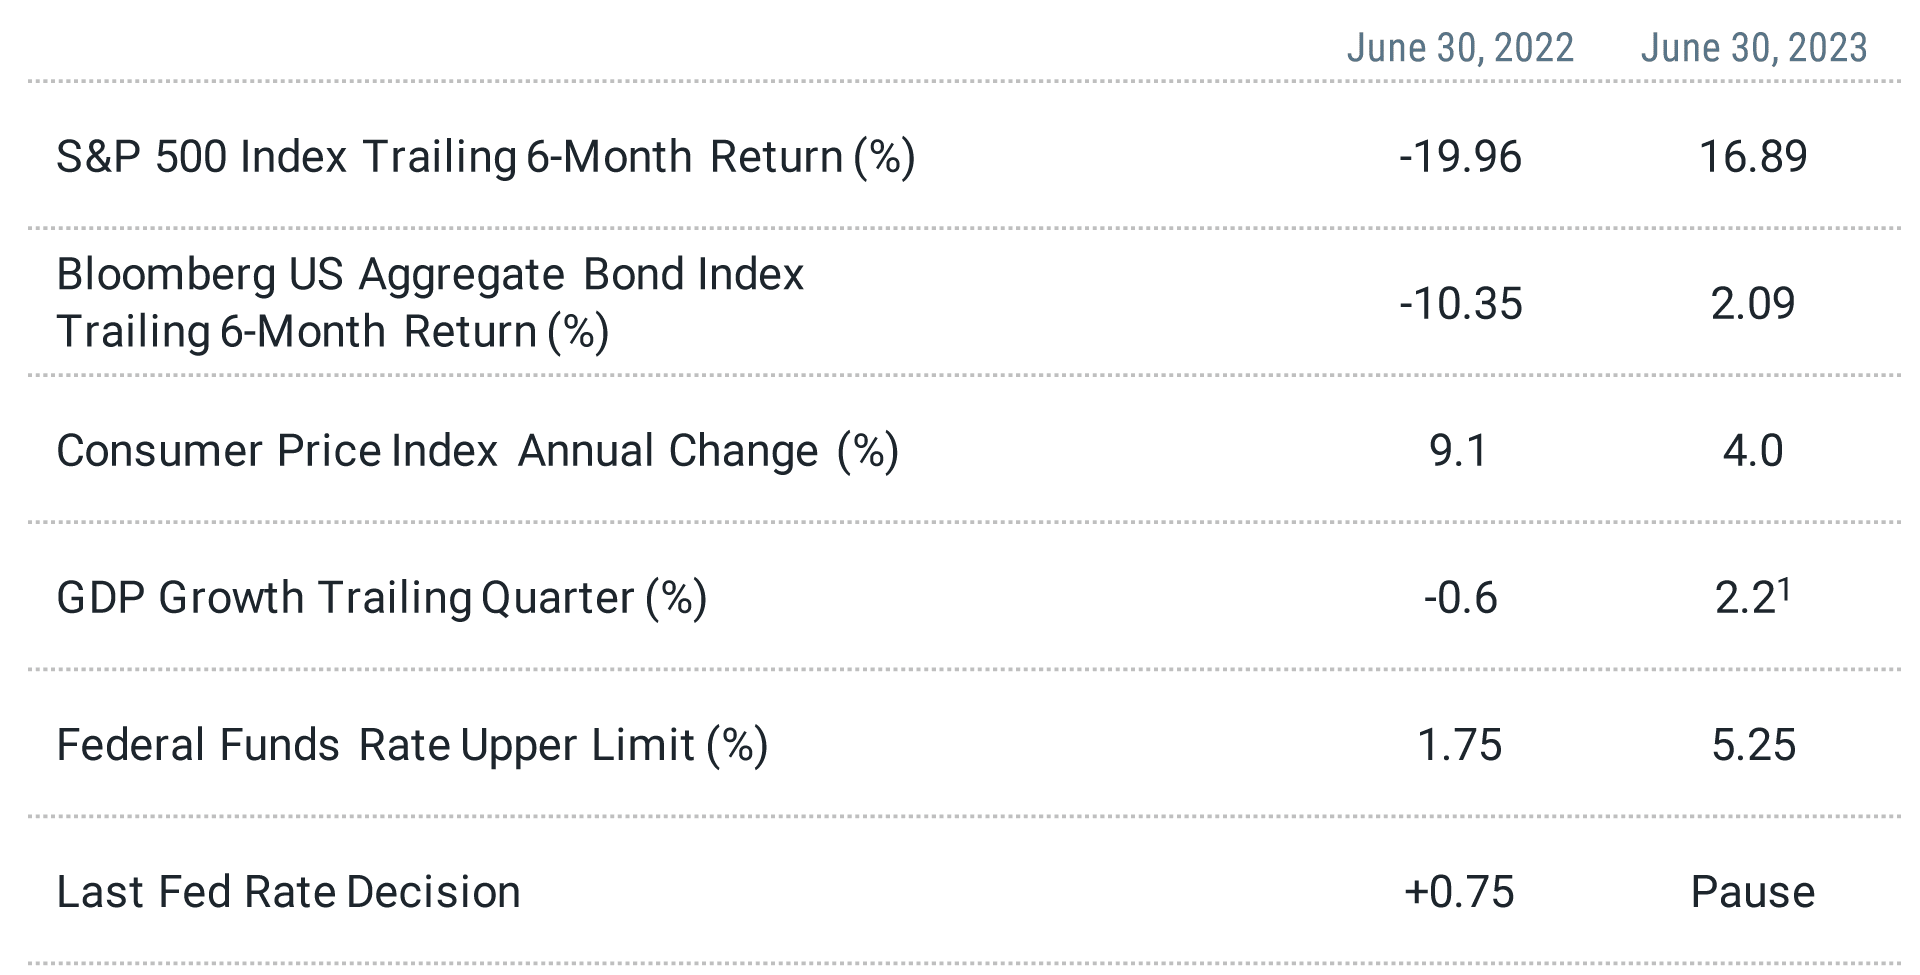
Data as of 6/30/2022 and 6/30/2023. Source: Bloomberg, Federal Reserve Board of Governors (FRED), U.S. Bureau of Labor Statistics, Bureau of Economic Analysis, and Federal Reserve Bank of Atlanta GDPNow.
¹Estimate from Federal Reserve Bank of Atlanta GDPNow.
A Note for Inflation-Sensitive Investors
While the rate of inflation has been declining, prices have continued to rise. This has an impact on future consumption that can be meaningful for some investors. The upside to consider, however, is that lower inflation expectations today mean generally lower costs to buy inflation insurance. As an example, equities with a higher link to inflation, which can help mitigate inflation risk, trade as value stocks today with higher-than-market expected returns.
Risk-Free Might not Be Without Risk
U.S. Treasury bonds are typically considered risk-free investments. Figure 2 shows the current U.S. Treasury yield curve — a plot of interest rates across Treasuries maturing at different periods — compared to a year ago. We can see that:
Across the board, yields are higher today than before.
Investors can earn much higher yields at very short maturities (e.g., Treasuries maturing in three months) versus longer maturities (e.g., Treasuries maturing in 10 or 20 years).
Figure 2 | The Treasury Curve Looks Different Today Than a Year Ago
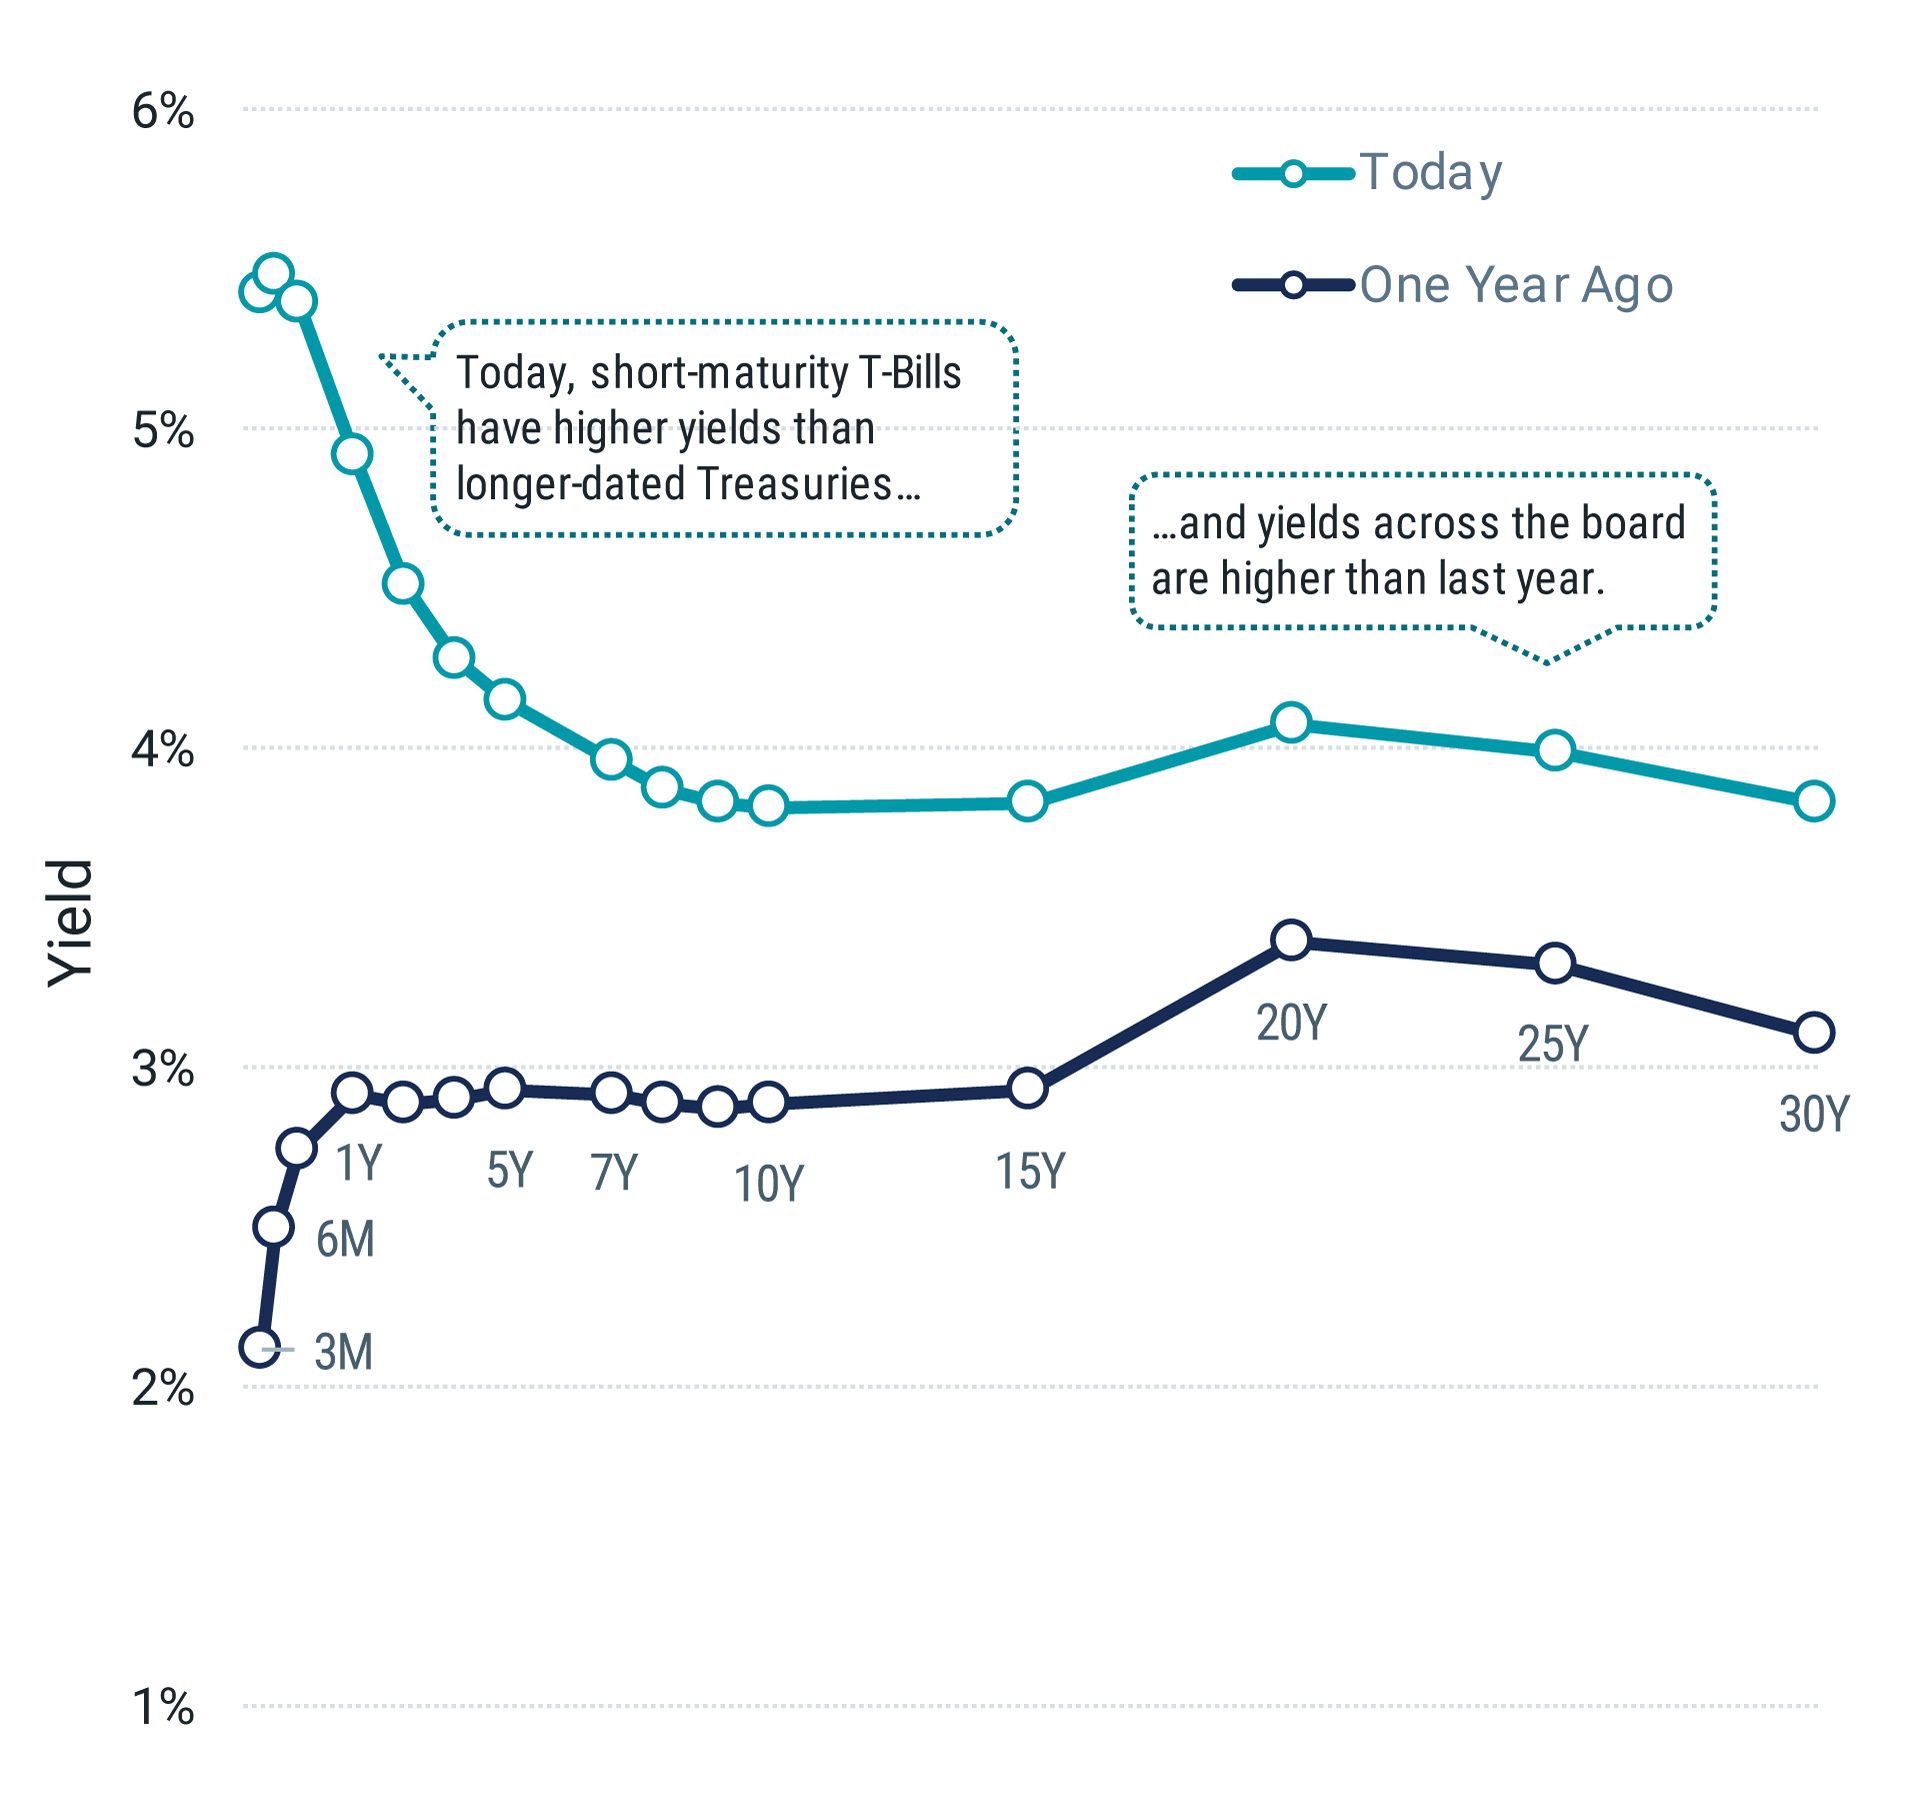
Data as of 6/30/2022 and 6/30/2023. Source: Bloomberg.
One potential takeaway is to see short-term Treasuries (T-Bills) as a solid investment with a yield of more than 5% and the backing of the U.S. government. In addition, the prices of shorter-term, lower-duration bonds generally don’t fluctuate meaningfully as rates rise. So, why not allocate one’s bond portfolio exclusively to T-Bills? Or maybe all of one’s portfolio to avoid the potential volatility of stocks?
There are a few considerations. First, the goal of the portfolio matters. T-Bills may be better suited for investors seeking extreme stability within their portfolio than for investors aiming for growth (more to come on this). Second, investors must contemplate reinvestment risk. If rates fall before these short-term bonds mature, buying new bonds may not produce the same level of return that an investor could lock in for longer with an intermediate bond today.
It may also mean forgoing the potential price appreciation from falling bond yields that longer-duration bonds may realize (bond prices rise as rates fall). These are important considerations for investors who do not need portfolios with high stability but have chosen to shorten the duration of their fixed-income allocations.
Looking Beyond U.S. Treasuries Can Make a Difference
What are the options for investors seeking moderate or more aggressive growth? In a word, diversification. Looking beyond Treasuries may provide diversification across issuers, the opportunity to increase yield, and greater potential for price appreciation if rates fall.
We present a current example in Figure 3 by comparing the BBB-rated U.S. corporate bond yield curve with the U.S. Treasury yield curve. Two things stand out.
BBB corporates offer higher yields than Treasuries across all maturities, reflecting in part differences in credit risk (more to come on this, too).
Unlike the sharply inverted Treasury curve, the BBB corporate curve is relatively flat.
As a result, investors can earn higher yields on longer-dated BBB corporates than Treasuries of the same maturity. This provides an opportunity to increase duration and lock in higher rates for longer than could be achieved today if the opportunity set were only Treasuries.
This doesn’t mean investors have to choose one or the other. Various mixes of bonds across multiple yield curves can offer both the potential benefits of issuer diversification as well as opportunities to address different investor goals (e.g., different aggregate duration profiles).
Figure 3 | Corporate Bonds Can Offer Opportunities for Higher Yields for Longer
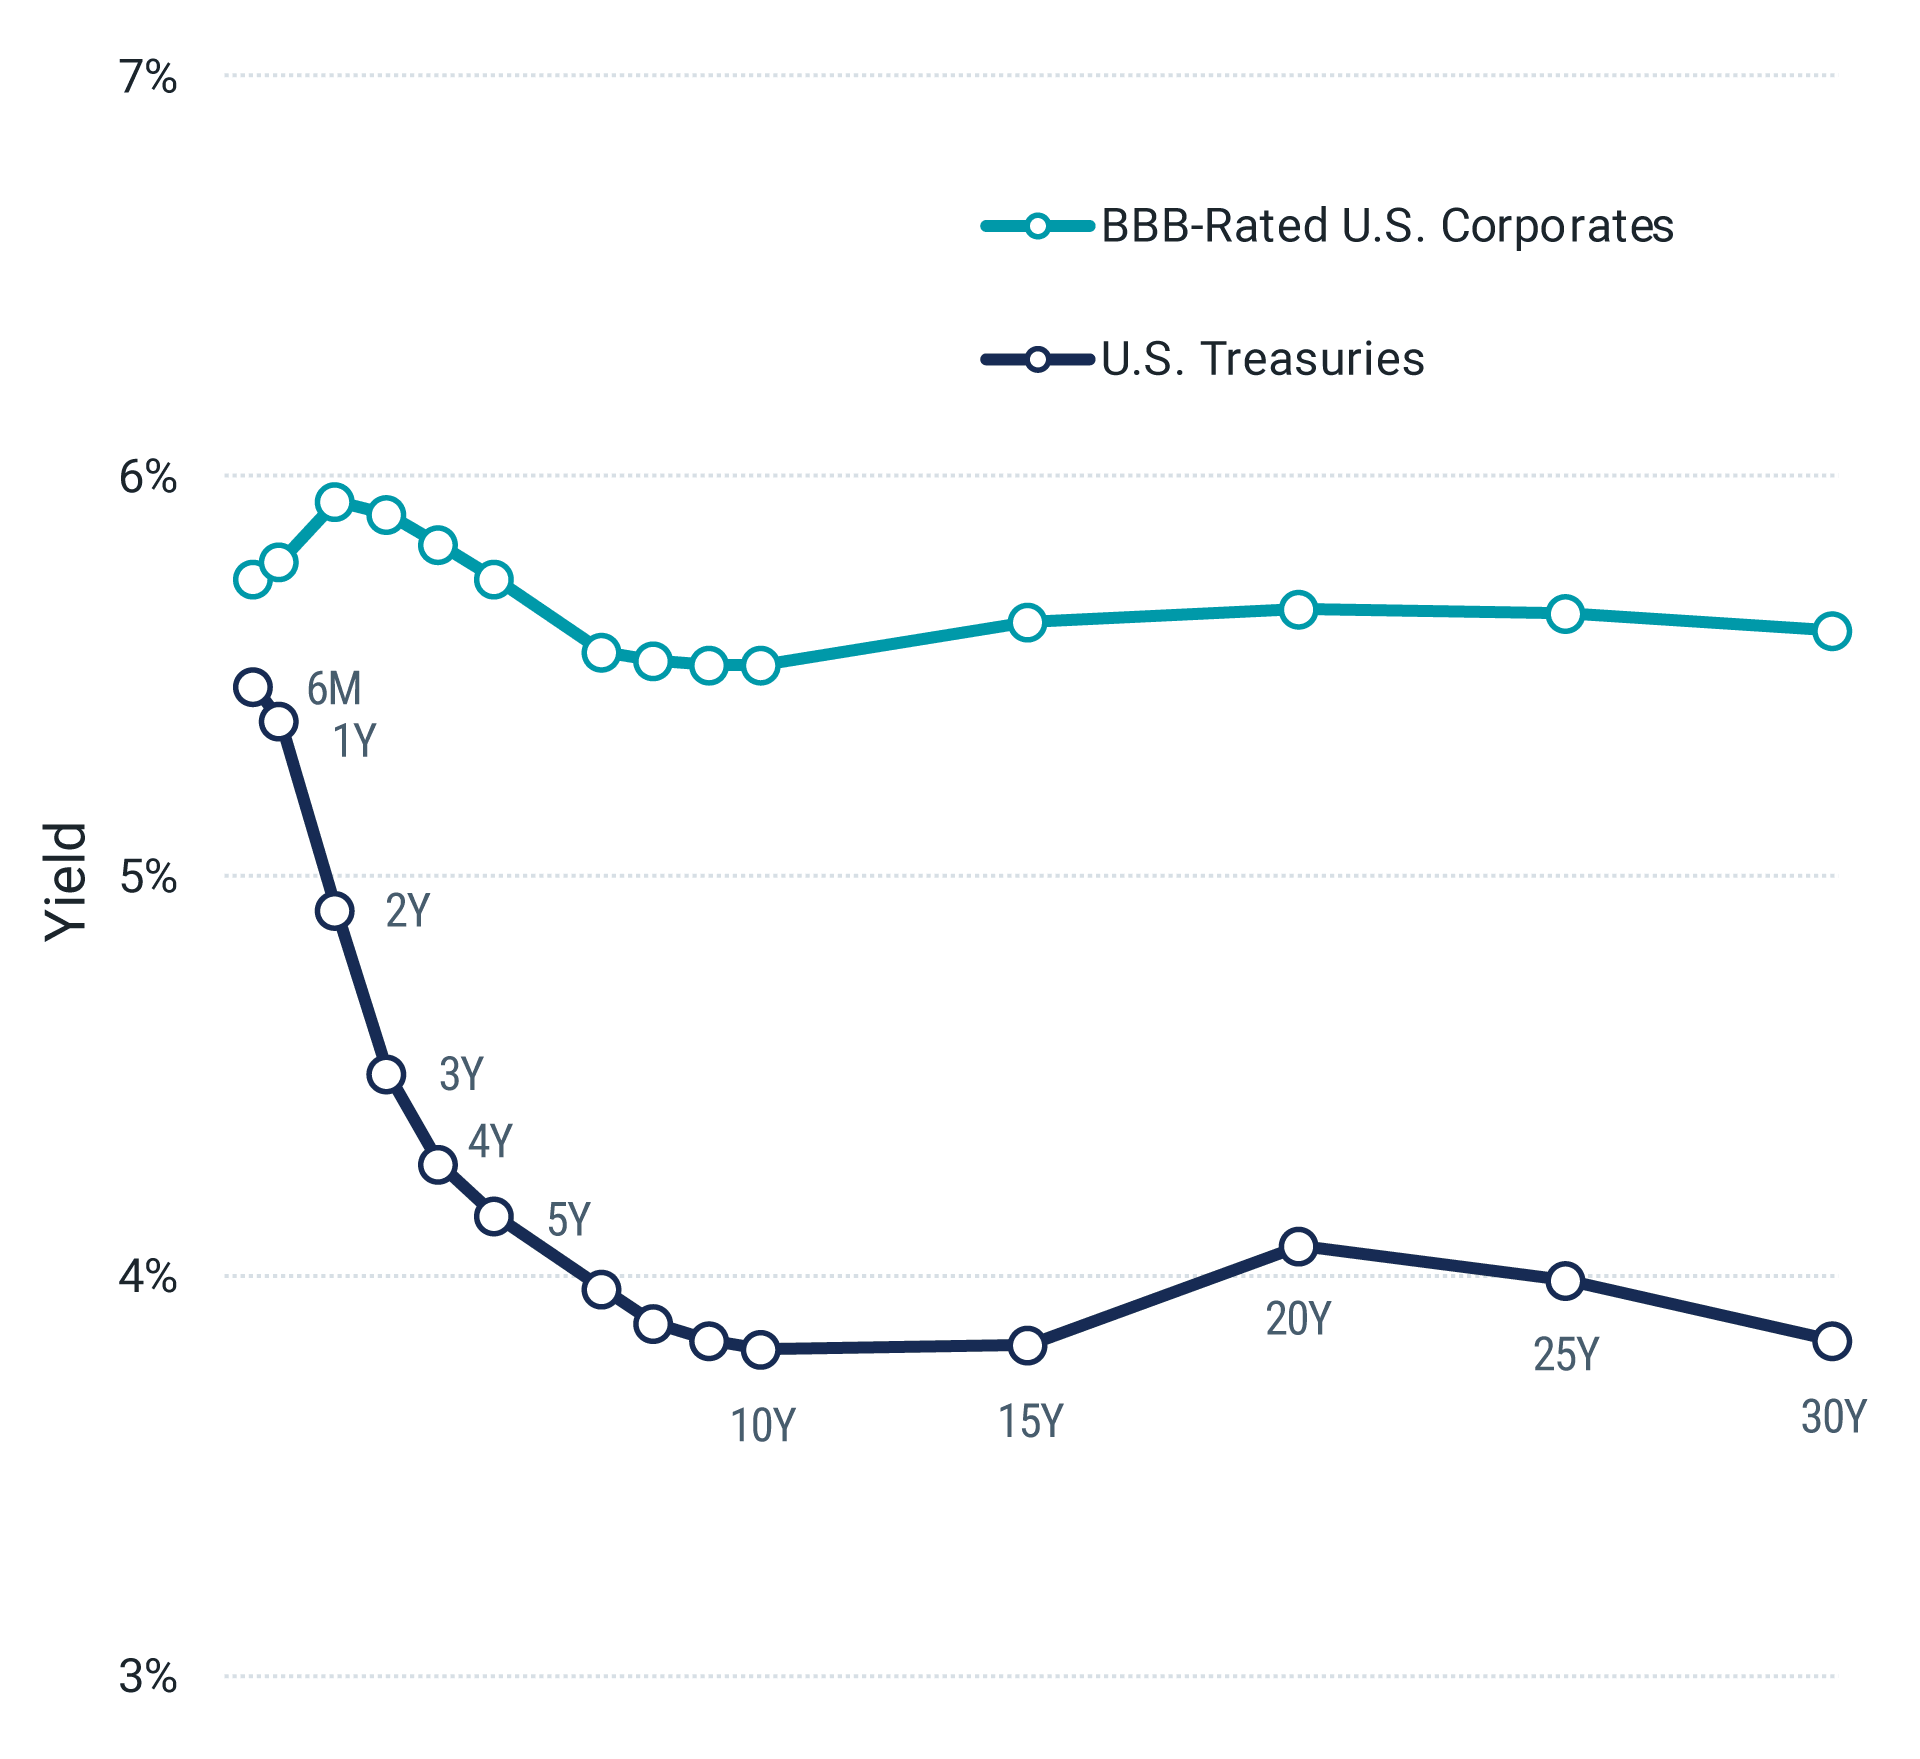
Data as of 6/30/2023. Source: Bloomberg.
To offer a little more context on the role of corporate bonds in fixed-income allocations designed for growth, consider the long-term returns of U.S. corporate bonds versus T-Bills and the broader U.S. Treasury market shown in Figure 4.
Figure 4 | Corporate Bonds Have Historically Outperformed Treasuries
Cumulative total return from 6/30/1997 - 6/30/2023
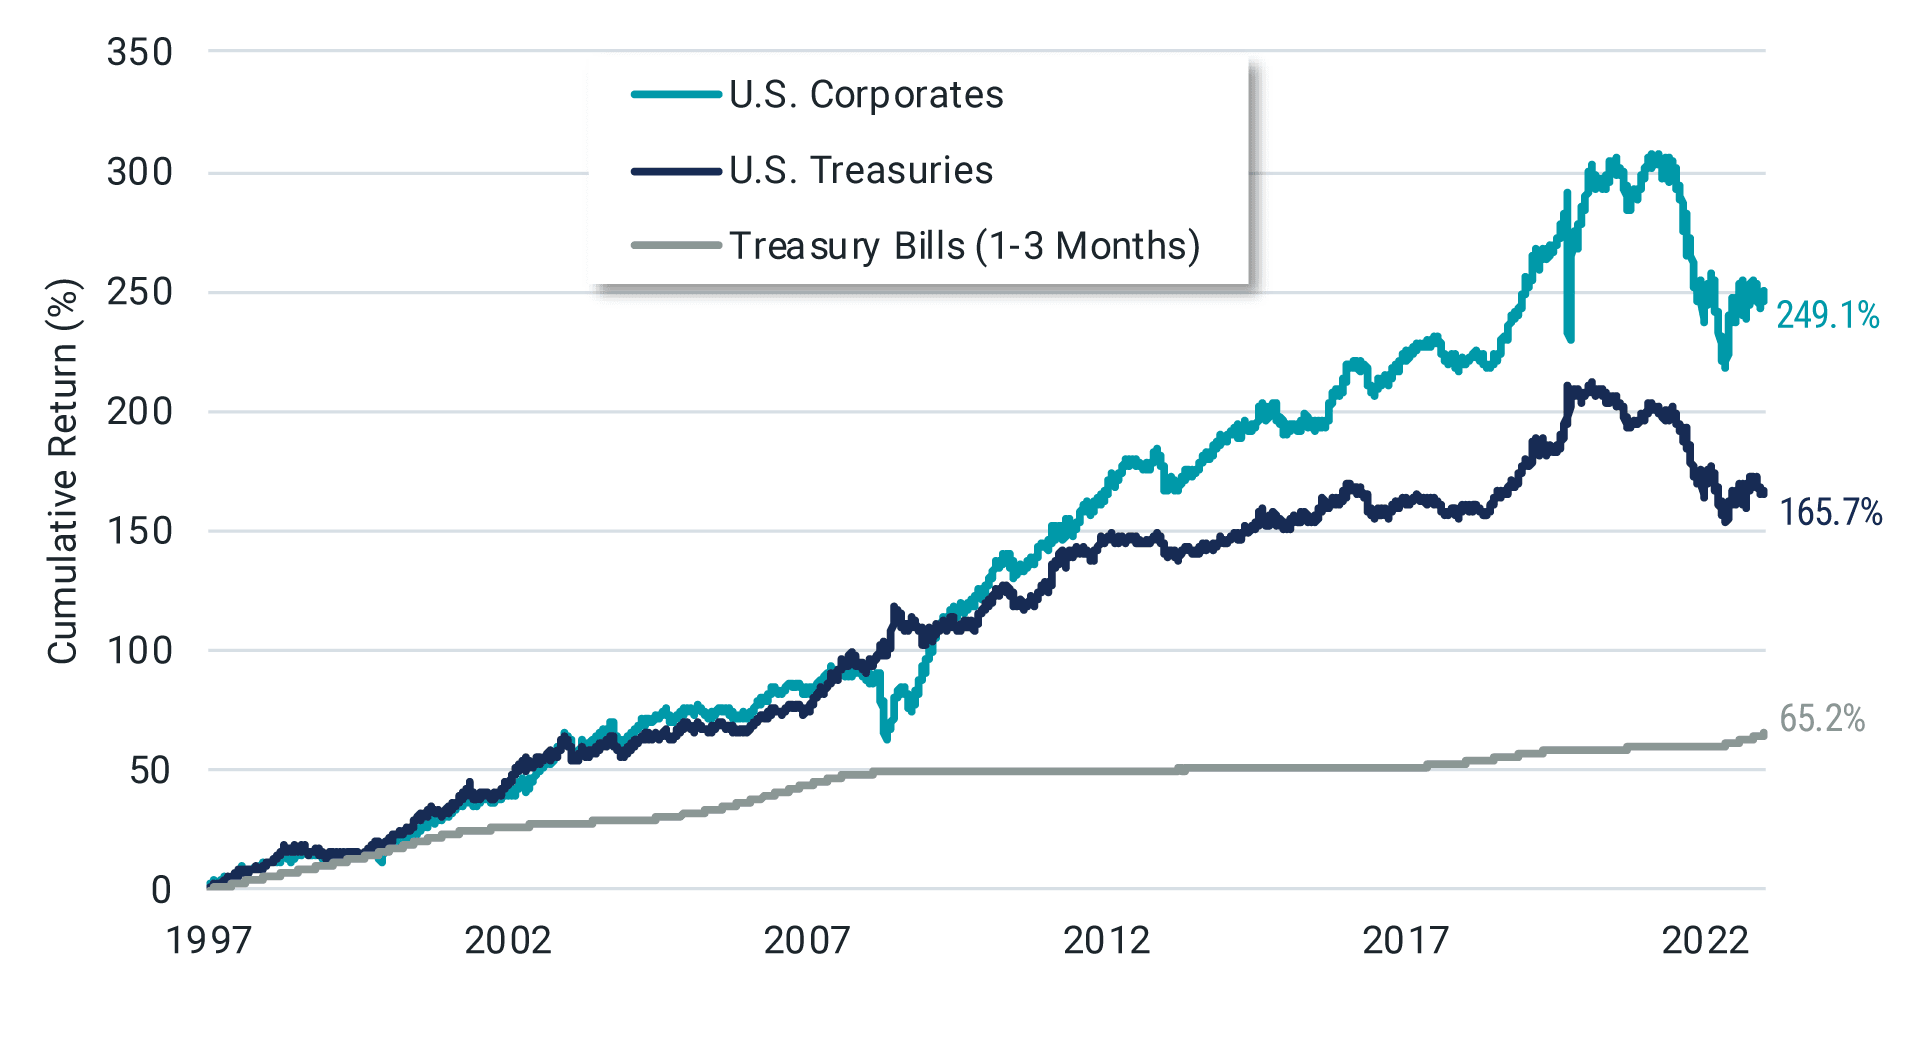
Data from 6/30/1997 - 6/30/2023. Source: Morningstar. U.S. Corporates, U.S. Treasuries and Treasury Bills (1-3 Months) are represented by the Bloomberg U.S. Corporate Bond Index, the Bloomberg U.S. Treasury Index and the Bloomberg U.S. 1-3 Month Treasury Bill Index, respectively.
And, while corporate bonds are expected to carry higher risk of default than Treasuries, it’s important to recognize that default rates have historically been low among investment-grade corporate bonds (those rated AAA to BBB). Default rates have been higher among high-yield bonds (those rated BB and below). See Figure 5.
Figure 5 | Investment Grade Bonds Have Historically Had Low Default Rates
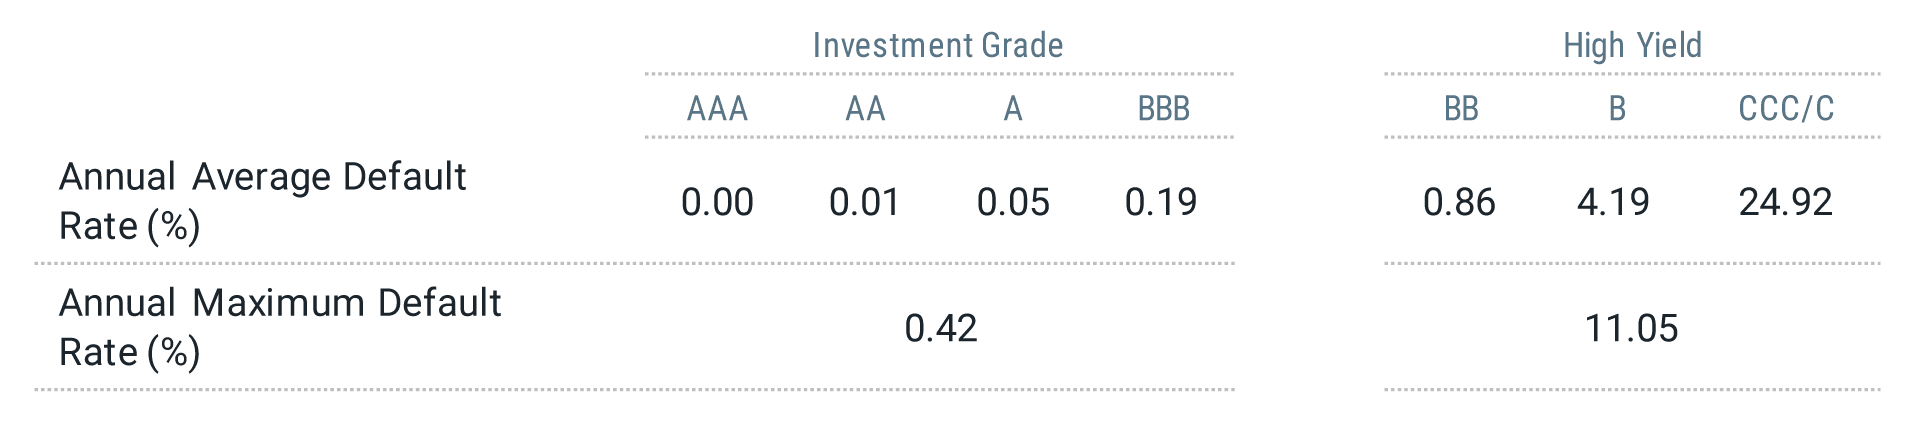
Data from 1981 – 2020. Source: S&P Global Ratings Research and S&P Global Market Intelligence’s CreditPro®. See Glossary for definitions of Credit Ratings, Credit Quality and Default Rate.
As with any investment, considering diversification levels of the strategy and how bonds are selected and weighted within the portfolio can have a meaningful impact on its expected performance. We believe strategies should look beyond just stated credit ratings and the level of outstanding debt an issuer has (as many indexes do).
Trying to Time Rate Cuts from the Fed May Fall Flat
Finally, we think investors should consider that attempting to precisely time interest-rate changes is, at best, a difficult game to play. Consider bond investors who shortened duration when the Fed was raising rates intending to extend duration once the Fed changed course. The challenge is that the market is forward-looking, and bond prices generally reflect expectations of the market each day.
We see evidence of this in Figure 6, which shows changes in the federal funds rate and the five-year Treasury yield. The Treasury yield (teal line) fell in 2018, and the Fed subsequently lowered rates in 2019 (dark blue line). Similarly, the Treasury yield began climbing in 2021, and the federal funds rate followed suit in 2022.
Figure 6 | Bond Yields Have Typically Moved Ahead of Rate Changes from the Fed
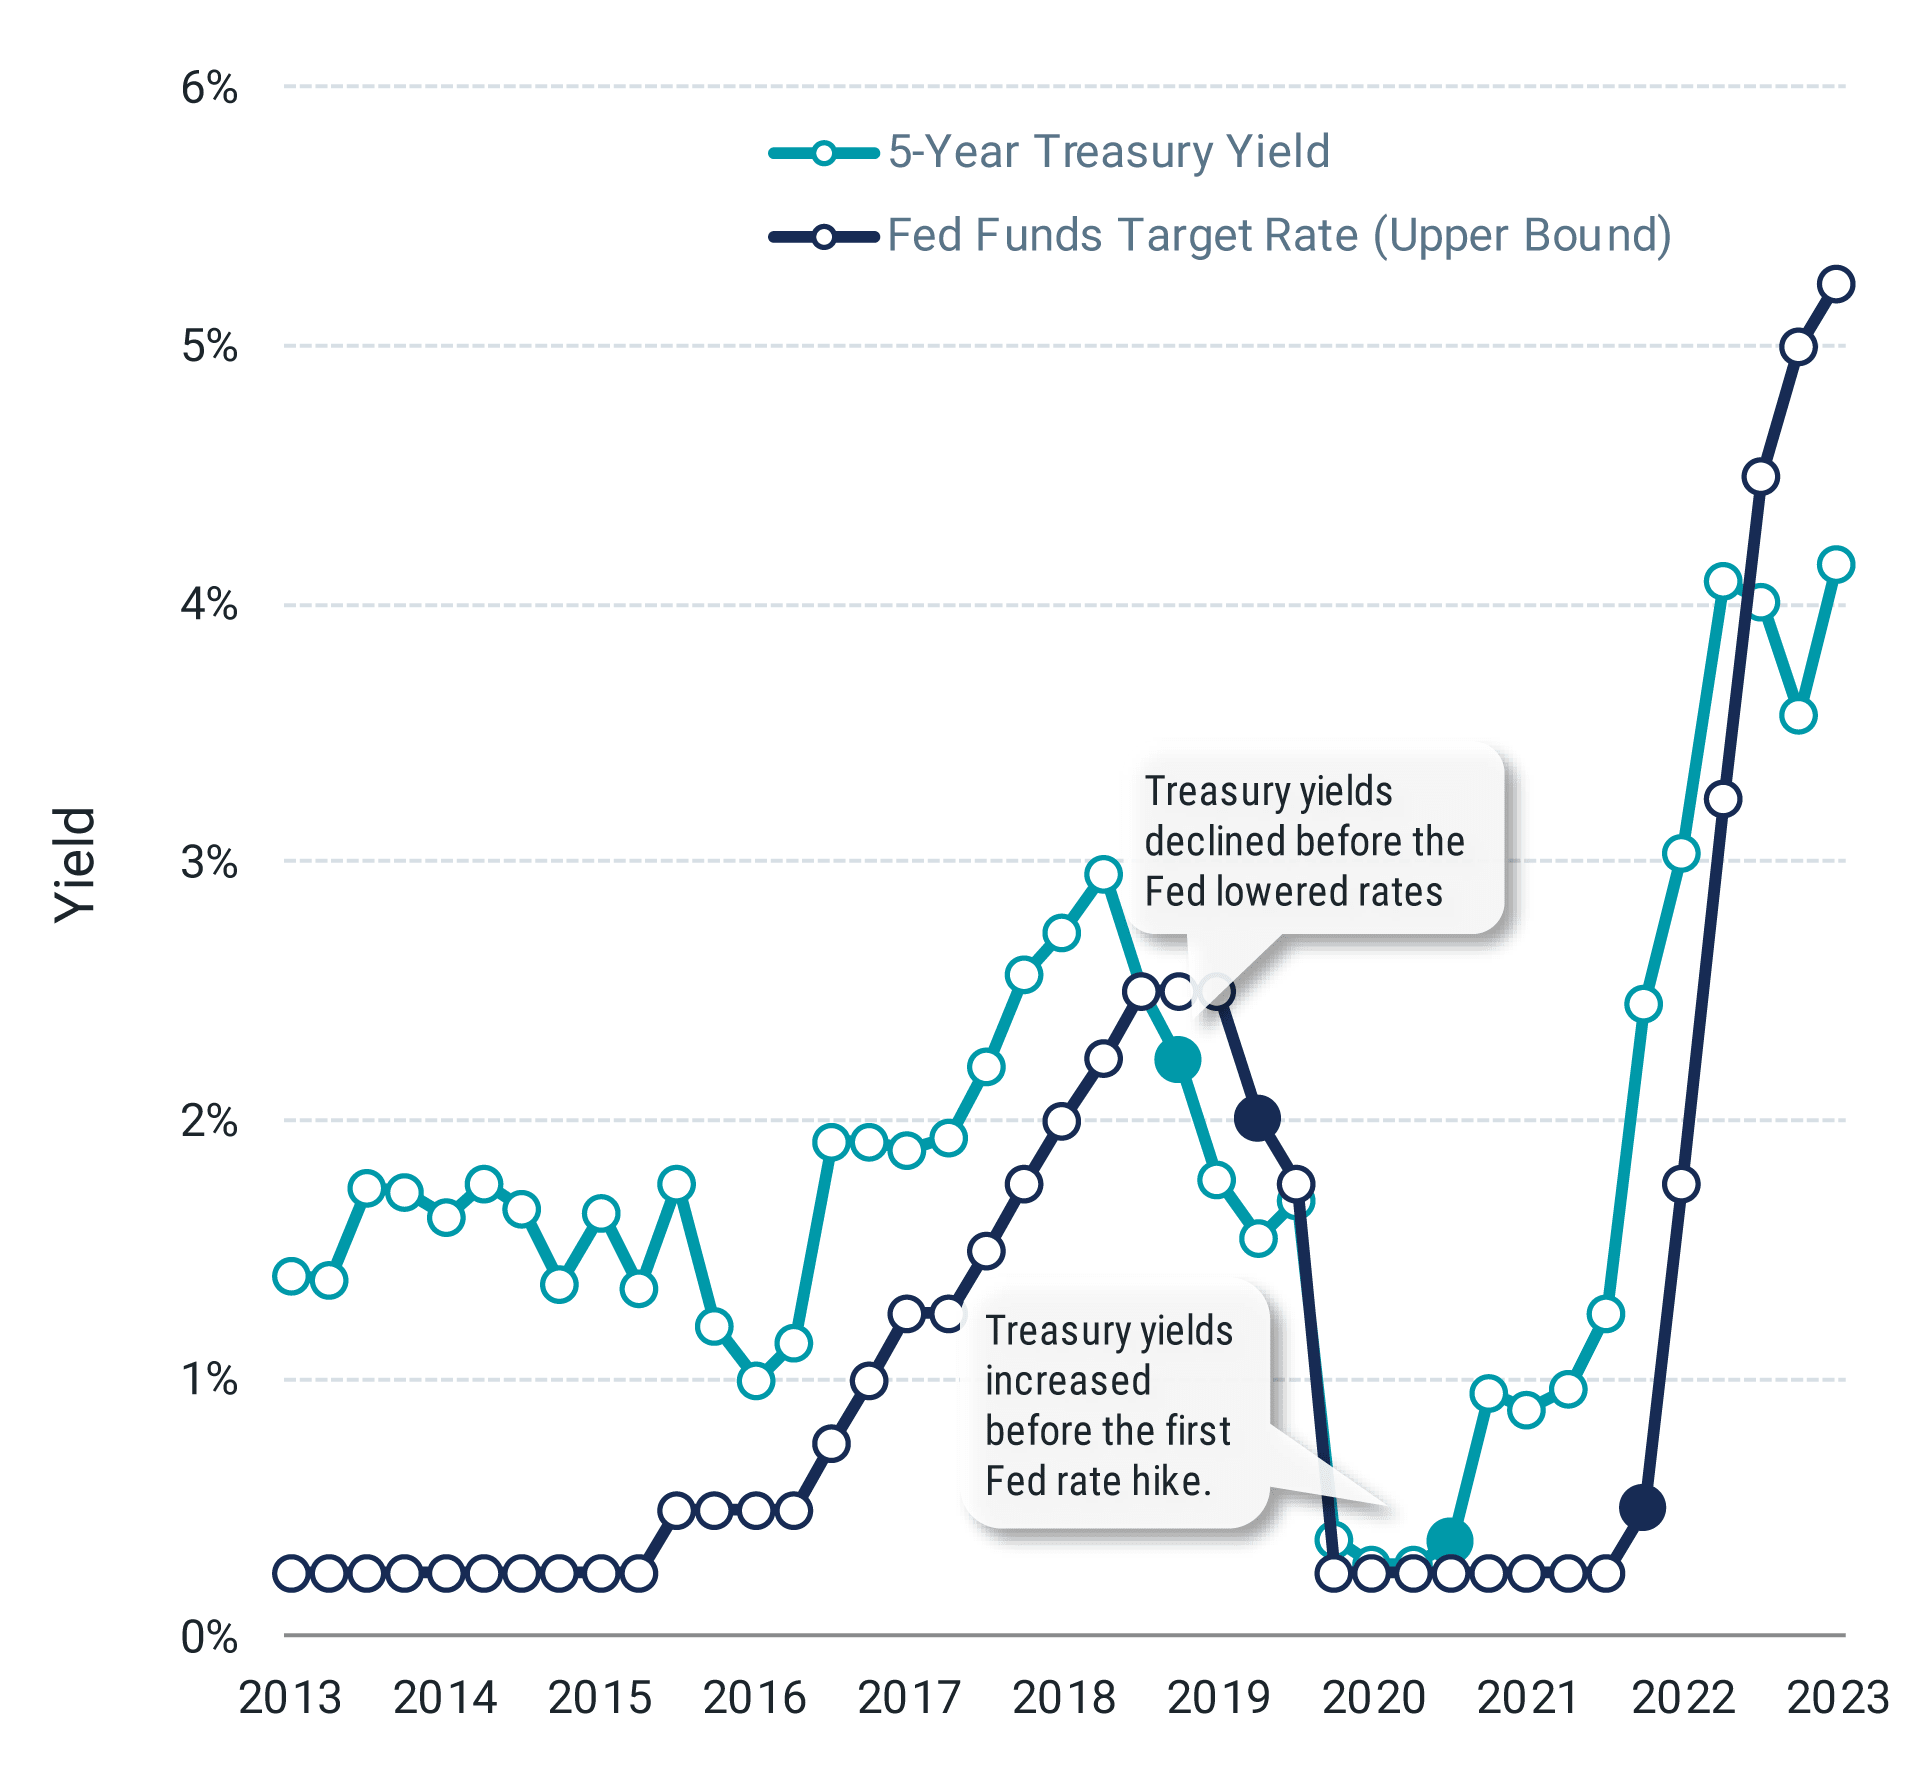
Data from 6/30/2013 – 6/30/2023. Source: Bloomberg.
The takeaway is that attempting to benefit from increasing duration in one’s fixed income portfolio after a Fed decision to lower rates may result in missing the boat. The market typically leads these types of announcements.
We believe a better course of action for investors is to allocate to a mix of bonds at a duration and level of credit quality that makes sense for their long-term goals and make small adjustments as goals and circumstances change. For investors who have shortened duration in the face of uncertain markets or perceived opportunities that have arisen from aggressive Fed action, we think it’s worth considering whether the allocation they have today fits their goals for tomorrow.
Glossary
Bloomberg U.S. 1-3 Month Treasury Bill Index: A subindex of the Bloomberg Barclays U.S. Short Treasury Index, the Bloomberg Barclays U.S. 1-3 Month Treasury Bill Index is composed of zero-coupon Treasury bills with a maturity between one and three months.
Bloomberg U.S. Aggregate Bond Index: Represents securities that are taxable, registered with the Securities and Exchange Commission, and U.S. dollar-denominated. The index covers the U.S. investment-grade fixed-rate bond market, with index components for government and corporate securities, mortgage pass-through securities and asset-backed securities.
Bloomberg U.S. Corporate Bond Index: Measures the investment-grade, fixed-rate, taxable corporate bond market. It includes U.S. dollar-denominated securities publicly issued by U.S. and non-U.S. industrial, utility and financial issuers.
Bloomberg U.S. Treasury Index: Measures U.S. dollar-denominated, fixed-rate, nominal debt issued by the U.S. Treasury. Treasury bills are excluded by the maturity constraint but are part of a separate Short Treasury Index.
Consumer Price Index (CPI): CPI is a U.S. government (Bureau of Labor Statistics) index derived from detailed consumer spending information. Changes in CPI measure price changes in a market basket of consumer goods and services such as gas, food, clothing, and cars. Core CPI excludes food and energy prices, which tend to be volatile.
Credit Quality: Describes the portfolio in terms of the quality ratings of the securities it holds. All U.S. government securities are included in the U.S. Government category. Cash and cash equivalents include payable amounts related to securities purchased but not settled at period end.
Credit quality ratings on underlying securities of a fund are obtained from three Nationally Recognized Statistical Rating Organizations (NRSROs), Standard & Poor's, Moody's and Fitch. Ratings are converted to the equivalent Standard & Poor's rating category for purposes of presentation. The median rating is used for securities rated by all three NRSROs. The common rating is used when two of the three NRSROs agree. The lower rating is used when only two NRSROs rate a security. A nonrated designation is assigned when a public rating is not available for a security. This designation does not necessarily indicate low credit quality. The letter ratings are provided to indicate the creditworthiness of the underlying bonds in the portfolio and generally range from AAA (highest) to D (lowest). Includes payable amounts related to securities purchased but not settled at period end.
Due to rounding, these values may exceed 100%. Negative weights, when quoted, may be due to open security or capital stock trades at period end and/or unrealized loss on derivative positions as a percent of net assets at period end. Fund holdings subject to change without notice.
Credit Rating: Standard & Poor’s credit ratings range from AAA (highest quality; perceived as least likely to default) to D (in default). Securities and issuers rated AAA to BBB are considered/perceived to be "investment-grade"; those below BBB are considered/perceived to be non-investment-grade (high yield).
Default Rate: Refers to the percentage of bond issuers that fail to make timely interest payments or repay the principal amount as per the terms of the bond agreement.
Duration: Measures how long it takes, in years, for an investor to be repaid a bond’s price by the bond’s total cash flows. It is also a measure of a bond’s interest rate sensitivity. The longer the duration, the more sensitive a bond is to interest rate shifts.
Federal Funds Rate: An overnight interest rate that banks charge each other for loans. More specifically, it's the interest rate charged by banks with excess reserves at a Federal Reserve district bank to banks needing overnight loans to meet reserve requirements. It's an interest rate that's mentioned frequently within the context of the Federal Reserve's interest rate policies. The Federal Reserve's Open Market Committee (FOMC) sets a target for the federal funds rate (which is a key benchmark for all short-term interest rates, especially in the money markets), which it then supports/strives for with its open market operations (buying or selling government securities).
Federal Open Market Committee (FOMC): FOMC is the committee that sets interest rate and credit policies for the Federal Reserve System, the U.S. central bank. The committee decides whether to increase or decrease interest rates through open-market operations of buying or selling government securities. The committee normally meets about eight times per year.
Gross Domestic Product (GDP): GDP is a measure of the total economic output in goods and services for an economy.
S&P 500® Index: A market-capitalization-weighted index of the 500 largest U.S. publicly traded companies. The index is widely regarded as the best gauge of large-cap U.S. equities.
Yield: The rate of return for bonds and other fixed-income securities. Price and yield are inversely related: As the price of a bond goes up, its yield goes down, and vice versa.
Yield Curve: The yield curve is a line graph showing the yields of fixed-income securities, such as Treasuries, over a range of different maturities (typically three months to 30 years), at a single point in time.
Yield to Maturity: The rate of return an investor will receive if an interest-bearing security, such as a bond, is held to its maturity date. It considers total annual interest payments, the purchase price, the redemption value, and the amount of time remaining until maturity.
Diversification does not assure a profit, nor does it protect against loss of principal.
International investing involves special risks, such as political instability and currency fluctuations. Investing in emerging markets may accentuate these risks.
©2024 Standard & Poor’s Financial Services LLC. The S&P 500® Index is composed of 500 selected common stocks most of which are listed on the New York Stock Exchange. It is not an investment product available for purchase.
It is not possible to invest directly in an index.
Investment return and principal value of security investments will fluctuate. The value at the time of redemption may be more or less than the original cost. Past performance is no guarantee of future results.
This material has been prepared for educational purposes only. It is not intended to provide, and should not be relied upon for, investment, accounting, legal or tax advice.