The Sum of Its Parts
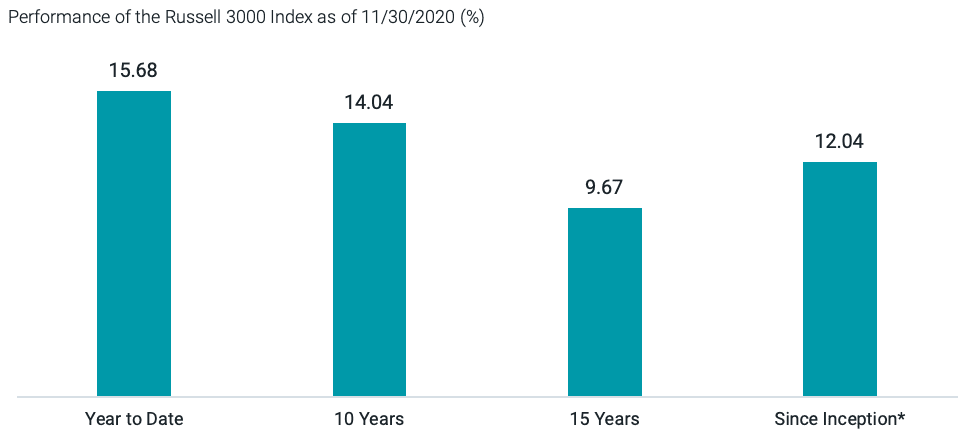
As of November 30, 2020, U.S. stocks posted a year-to-date return of more than 15%. As Figure 1 shows, if investors compared this year’s return to the index’s longer-term performance, they might conclude 2020 was an average or perhaps above-average year for stocks. But we all know this year has been anything but average. Amid a pandemic and an intense election cycle, stockholders experienced extreme volatility.
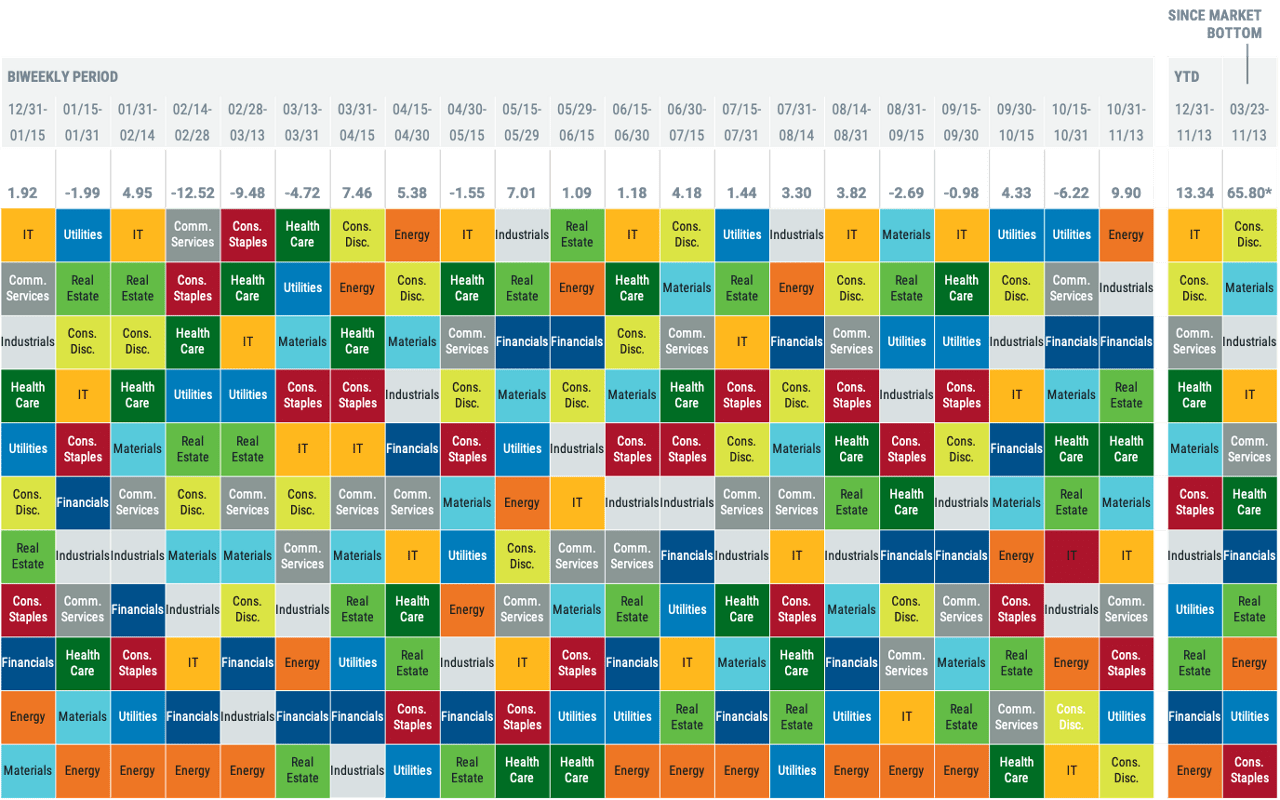
Some of this volatility is illustrated in Figure 2, which shows the bi-weekly returns and year-to-date return for the Russell 3000 Index. Two-week returns ranged from a high of 9.90% (during the period that included the election and its immediate aftermath) to a low of -12.52% at the onset of COVID-19 fears in the U.S.
The exhibit also shows how sectors performed during each two-week window, ranked from best to worst. Some sector returns were higher than the overall index, and others were lower. The variability in sector returns stands out, illustrating the difficulty of consistently predicting which sector will outperform. In fact, for the 21 two-week periods so far this year, every sector was the top performer at least once except financials. Similarly, eight of the 11 sectors have been the worst performer at least once. It’s also notable that sector rankings since the market bottom on March 23 look much different than rankings for the full period. Many sectors that suffered during the downturn recovered significantly since then. This helps illustrate the importance of maintaining discipline in the face of market volatility.
FIGURE 1 | UPON FIRST GLANCE, 2020 SEEMS TO BE AN ABOVE-AVERAGE YEAR FOR U.S. STOCKS

*Inception date for the Russell 3000 Index is 12/31/1978. Returns over periods greater than one year have been annualized. Source: Morningstar.
FIGURE 2 | SECTOR PERFORMANCE CAN BE ALL OVER THE MAP

*Extraordinary performance is attributable in part to unusually favorable market conditions and may not be repeated or consistently achieved in the future. Data from 12/31/2019 – 11/13/2020. Source: Avantis Investors, Bloomberg.
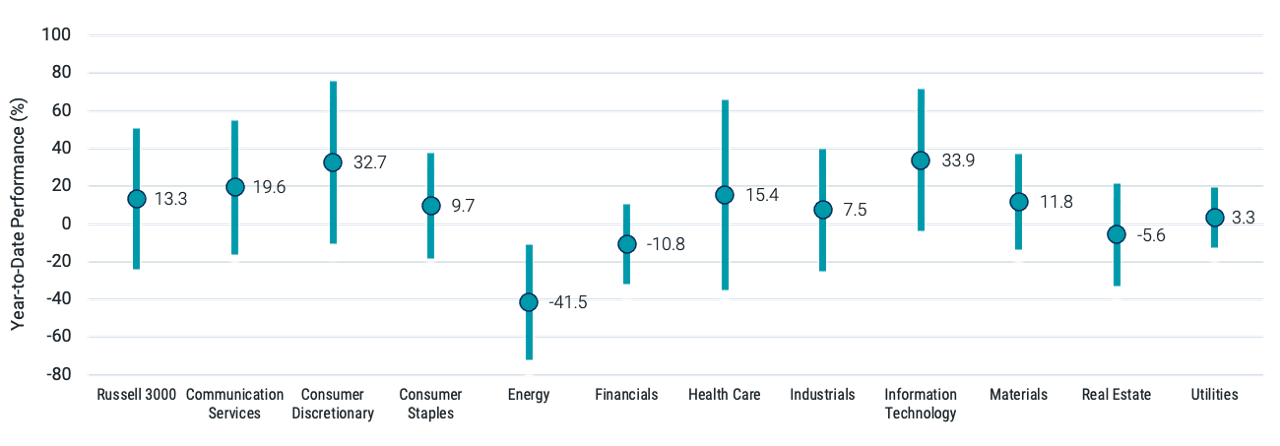
When we deconstruct the index’s year-to-date total return, we can see some sectors have performed meaningfully better than others. As shown in Figure 3, consumer discretionary (32.7%) and information technology (33.9%) performed best, while energy (-41.5%) lagged.
Each sector’s return is made up of the returns of each company in the sector. Alongside the total index returns in Figure 3, we show the dispersion, or how widely individual stock returns varied, within each sector. We ranked each sector’s constituent stocks by their year-to-date return and plotted a high and low return based on the 15th and 85th percentile rankings. For example, while consumer discretionary stocks returned 32.7% overall, we observed a big difference between “high return stocks” (76%) and “low return stocks” (-10%).
We believe this analysis provides two important takeaways for investors. First, while it may be tempting to try to pick a specific sector or stock that could outperform, concentrating your investments into a single stock or sector greatly increases the range of potential outcomes. While this strategy could generate great profits if you’re right, it could also lead to disastrous results if you’re wrong.
Second, embracing broad diversification means that not every stock or sector must increase in value for your portfolio to earn a positive return. Sometimes, volatility can scare us into thinking we should only hold “safe” investments or familiar companies. However, we believe long-term stock returns illustrate that investors who buy and hold diversified portfolios for the long term have been rewarded.
FIGURE 3 | SECTOR COMPONENTS SHOW WIDE RETURN DISPARITY

Data from 12/31/2019 – 11/13/2020. Source: Avantis Investors, Bloomberg.
Investment return and principal value of security investments will fluctuate. The value at the time of redemption may be more or less than the original cost. Past performance is no guarantee of future results.
Diversification does not assure a profit nor does it protect against loss of principal.
The opinions expressed are those of the portfolio team and are no guarantee of the future performance of any Avantis fund.
This material has been prepared for educational purposes only. It is not intended to provide, and should not be relied upon for, investment, accounting, legal or tax advice.