The Same, but Different: An Update on Stock Valuations
Last year around this time, we reported that U.S. large cap growth stocks - represented by the Russell 1000® Growth Index - had returned 18.26% through the first seven months of 2020. So far in 2021, the performance of large growth stocks has been remarkably similar—up 16.71% through the end of July.
But the economic backdrop and broader stock market environment are starkly different now. The Russell 3000® Index is up 17.06% to date this year, compared to just 2.01% through the first seven months of 2020. This disparity is largely due to the performance of value stocks in 2021.
Figure 1 compares year-to-date size and style buckets for U.S. stocks through July 31 of 2020 and 2021. While returns of large growth stocks were similar, returns for value stocks so far in 2021 look nothing like they did over the same period in 2020.
Figure 1 | This Time Last Year Was All About Large Growth, but 2021 Is Different

Data as of 7/31/2021. Source: Morningstar. Past performance is no guarantee of future results. Investing involves risk including the possible loss of principal. Indices represented are the Russell 1000 Growth and Value and Russell 2000 Growth and Value.
The year-to-date 2021 performance of value stocks is part of a slightly longer period of resurgence for value, which has been welcome news to value investors and a reassurance that fundamentals still matter.
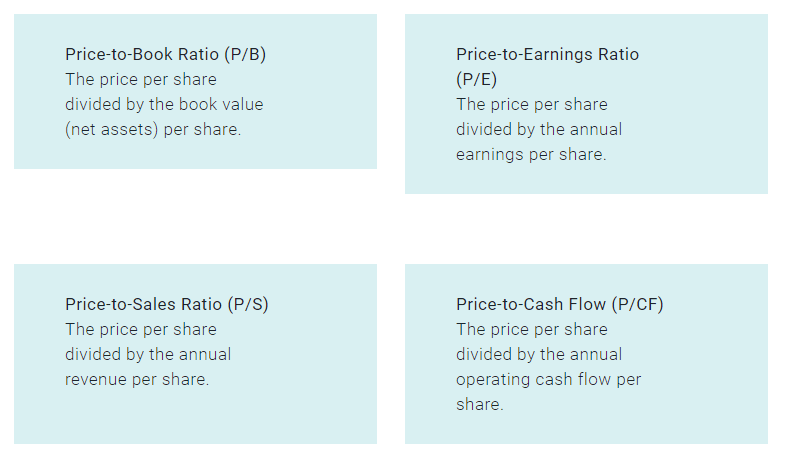
Given the recent strong performance, one question investors may be asking is how valuations (the price of stocks relative to fundamentals like earnings, sales, book value, etc.) stack up for value and growth stocks today.

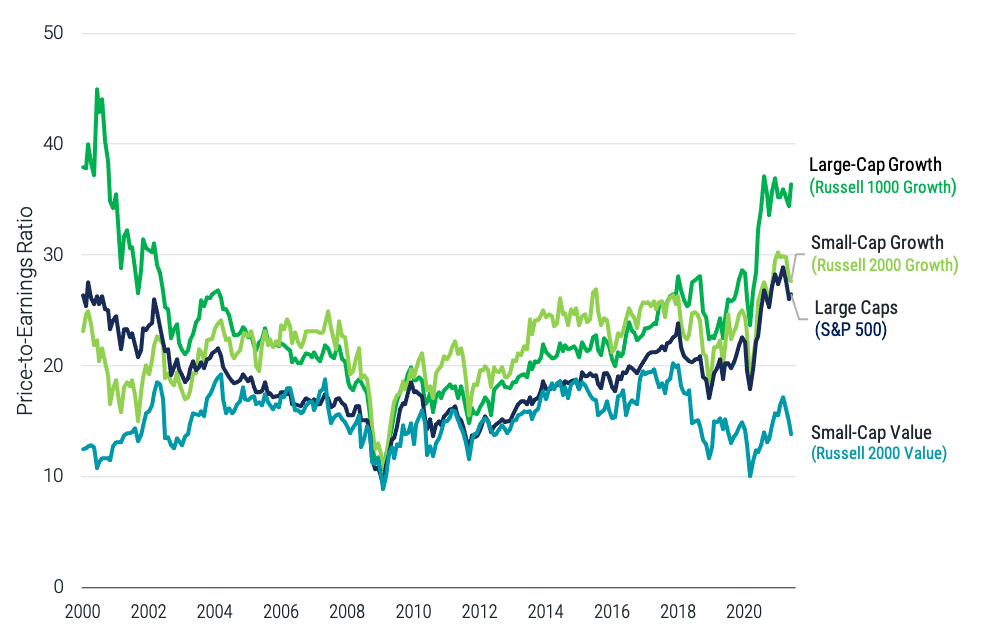
Figure 2 plots P/E ratios for four common indices representing large-cap growth, large cap, small-cap growth and small-cap value stocks. As we noted last summer, valuations for large growth stocks have advanced considerably compared to the rest of the market over the last decade.
Each of these ratios has two components—price and the respective fundamental, and as is the case with any ratio, changes in the numerator and the denominator can influence them. Growth stocks tend to trade at higher multiples because there are expectations of higher future growth. The P/E ratio for the Russell 1000® Growth Index has effectively doubled over the last 11 years. So, what happened? Haven’t earnings grown?
Figure 2 | Price-to-Earnings Ratios Through Time

Data from 1/1/2000 - 6/30/2021. Source: FactSet. It is not possible to invest directly in an index. Past performance is no guarantee of future results.
Earnings have grown for large growth stocks. By our estimation, earnings grew by approximately 194% between January 2010 and July 2021. However, the price increase advanced even more, growing by 492% over that same period.
By way of comparison, small value stocks' earnings increased by 177% between January 2010 and July 2021, but the price return was in line with the earnings growth at 181% over that same period.
The difference between the price increase versus the earnings growth was much larger for large growth stocks, and this drives their current high valuations.
What Can We Learn From Stock Valuations?
Research has shown some relation between valuation ratios and future returns. When differences between valuation ratios of growth and value stocks are high, we expect the value premium going forward to be higher than average.1 While this link between valuation ratios is interesting, the information is not strong enough to provide any timing clues to act on it. The expectation of higher premiums is too open ended.
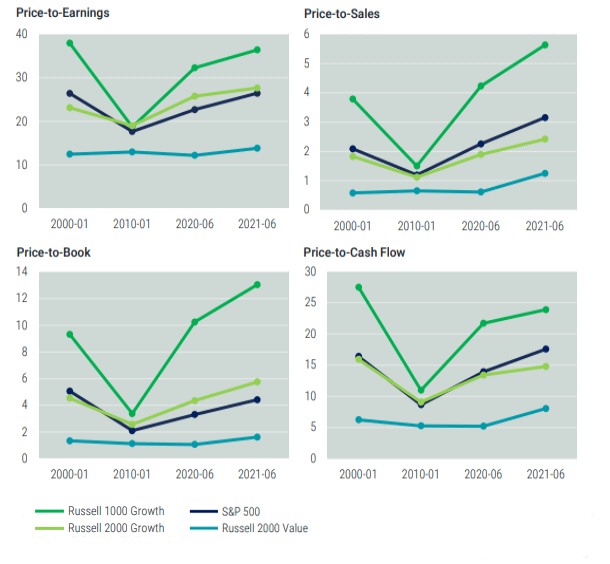
Despite this disappointing fact, it is interesting to look at valuation ratios and think about long-term expectations given current security prices. Current large-cap growth P/E ratios are higher than they have been over the last 10 years and similar to the ratios of the early-2000s. Small-cap value ratios have not changed as significantly over the same period. Other valuation ratios show a similar pattern, as illustrated.
While value stocks have outperformed recently, from a valuation perspective they are still trading much closer to long-term averages than growth stocks (particularly large caps), which can be an indication of their potential expected returns.
Figure 3 | Changes in Valuation Metrics from 2000 to 2021

Data from 1/1/2000 - 6/30/2021. Source: Morningstar.
Glossary
Expected Returns: Valuation theory shows that the expected return of a stock is a function of its current price, its book equity (assets minus liabilities) and expected future profits, and that the expected return of a bond is a function of its current yield and its expected capital appreciation (depreciation). We use information in current market prices and company financials to identify differences in expected returns among securities, seeking to overweight securities with higher expected returns based on this current market information. Actual returns may be different than expected returns, and there is no guarantee that the strategy will be successful.
Russell 1000® Growth Index. Measures the performance of those Russell 1000 Index companies (the 1,000 largest publicly traded U.S. companies, based on total market capitalization) with higher price-to-book ratios and higher forecasted growth values.
Russell 2000® Growth Index. Measures the performance of those Russell 2000 Index companies (the 2,000 smallest of the 3,000 largest publicly traded U.S. companies, based on total market capitalization) with higher price-to-book ratios and higher forecasted growth values.
Russell 2000® Value Index. Measures the performance of those Russell 2000 Index companies (the 2,000 smallest of the 3,000 largest publicly traded U.S. companies, based on total market capitalization) with lower price-to-book ratios and lower forecasted growth values.
Russell 3000® Index. Measures the performance of the largest 3,000 U.S. companies representing approximately 98% of the investable U.S. equity market.
S&P 500® Index. A market-capitalization-weighted index of the 500 largest U.S. publicly traded companies. The index is widely regarded as the best gauge of large-cap U.S. equities.
ENDNOTES
1 Sunil Wahal, Ph.D., “The Value Spread and the Value Premium,” Avantis Investors, February 2020.
This material has been prepared for educational purposes only. It is not intended to provide, and should not be relied upon for, investment, accounting, legal or tax advice.
Investment return and principal value of security investments will fluctuate. The value at the time of redemption may be more or less than the original cost. Past performance is no guarantee of future results.
Diversification does not assure a profit nor does it protect against loss of principal.