Summing Up 2021
Despite the many reasons one could have found for stocks to retreat, 2021 proved to be another strong year, as the S&P 500 Index® returned 28.7%. While the global stock market (and the U.S. stock market for that matter) comprise much more than just these 500 companies, the index is seen as a useful gauge for the stock market. We can also glean plenty of lessons and insights from its history.
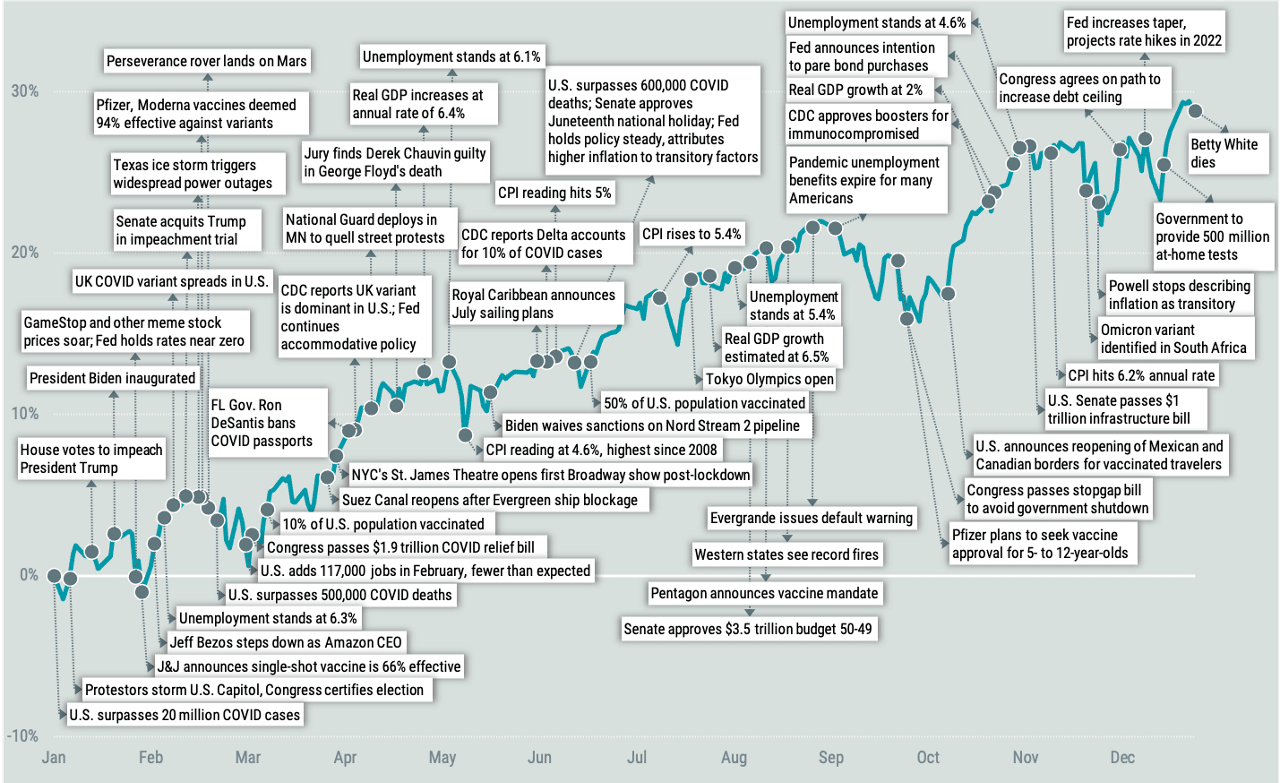
Figure 1 plots the cumulative daily return for the S&P 500 Index for the year alongside as many noteworthy headlines and events we could fit while keeping it somewhat legible.
Figure 1 | S&P 500® Index Total Return and Headlines in 2021
VIEW PDF OF THIS IMAGE> Data from 1/1/2021 - 12/31/2021. Source: ICI, FactSet, Avantis Investors. Past performance is no guarantee of future results.
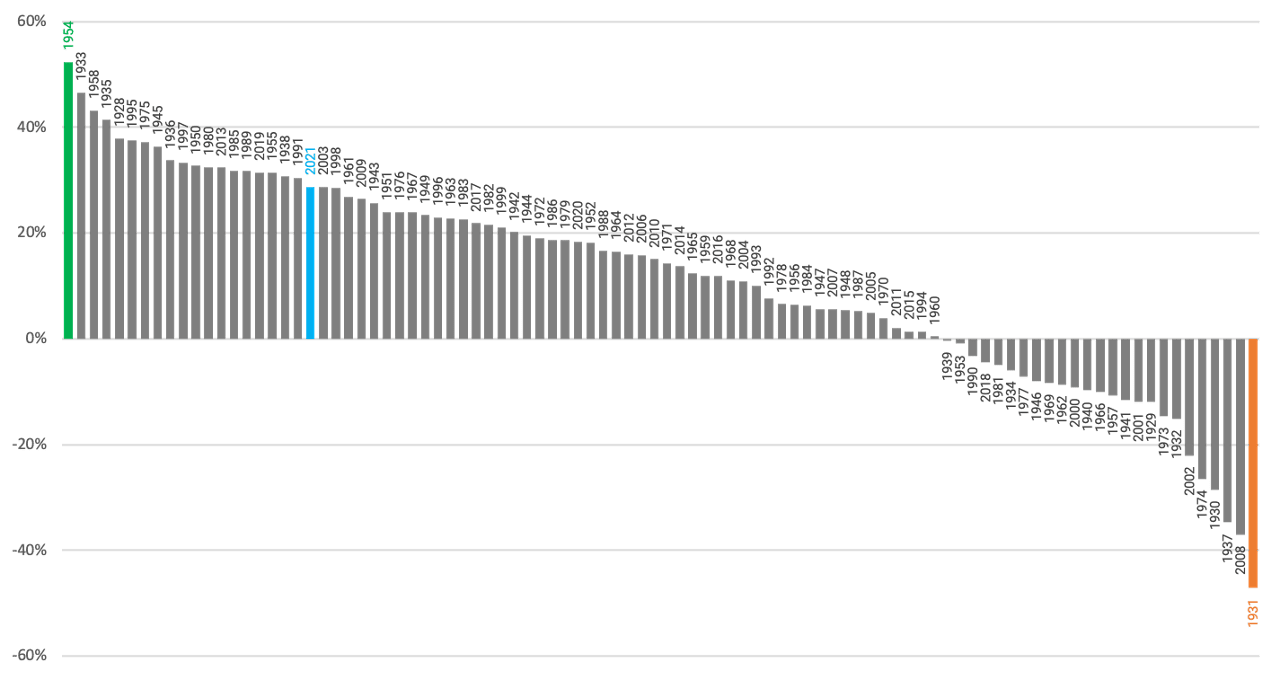
By most measurements, 2021 was a great year for the S&P 500. Figure 2 shows how 2021 stacks up compared to calendar year returns since 1928. 2021’s return of 28.7% ranks 20th best out of the 94 years in this period and is markedly higher than the 11.7% average annual return. The best annual return was in 1954, when the index returned 52.3%. The worst annual return came in 1931, when the index lost 47.1% of its value
Figure 2 | S&P 500 Index Calendar Year Returns (Highest to Lowest)
Data from 1/1/1928 - 12/31/2021. Source: Bloomberg Past performance is no guarantee of future results.
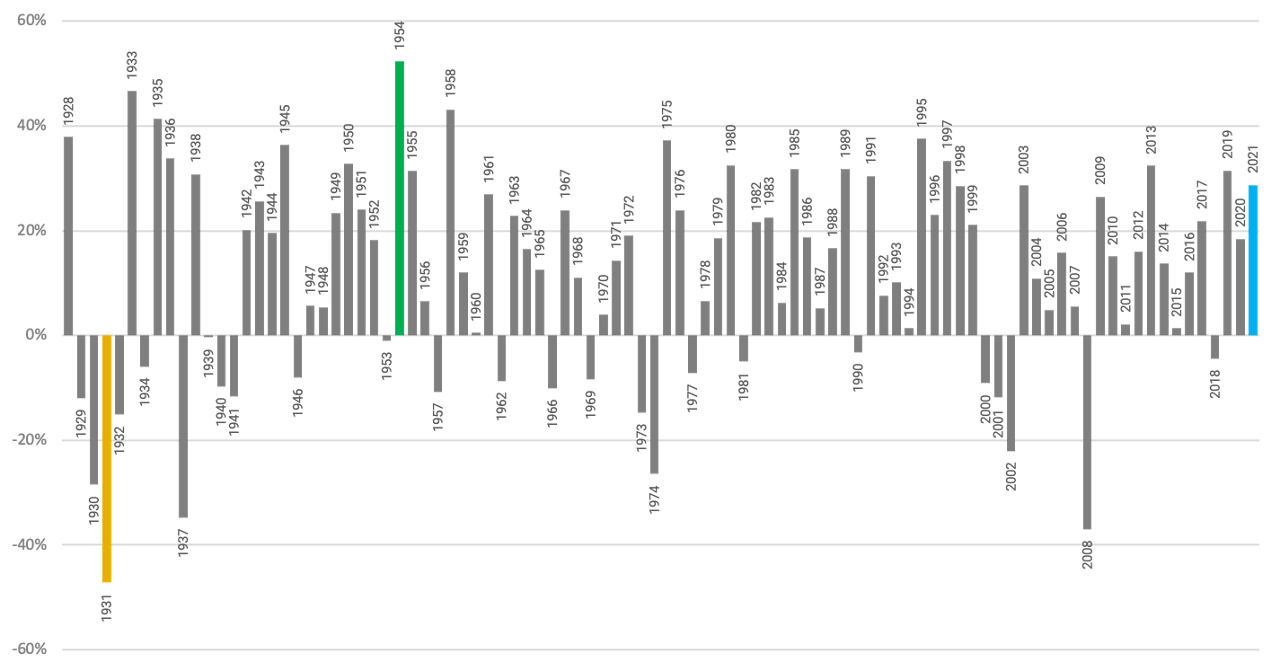
The other notable observation in this data series is the absence of any discernable pattern in these returns (Figure 3). Great years aren’t always followed by poor years and vice versa. As investors, history reminds us that a longer-term lens can help increase our chances of earning the long-term returns that capital markets have generated.
Figure 3 | S&P 500 Index Calendar Year Returns (By Year)
Data from 1/1/1928 - 12/31/2021. Source: Bloomberg. Past performance is no guarantee of future results.
A Closer Look at 2021
While U.S. large-cap stocks finished markedly higher for 2021, it wasn’t necessarily a smooth ride. As evidenced by some of the headlines in Figure 1, investors had no shortage of reasons to worry about future potential returns and consider exiting the market.
However, once again, 2021 provided us all some lessons about how trying to time the market is unlikely to leave us better off than just staying the course. Figure 4offers a few additional statistics surrounding S&P 500 Index returns for the year.
Figure 4 | S&P 500® Index by the Numbers in 2021
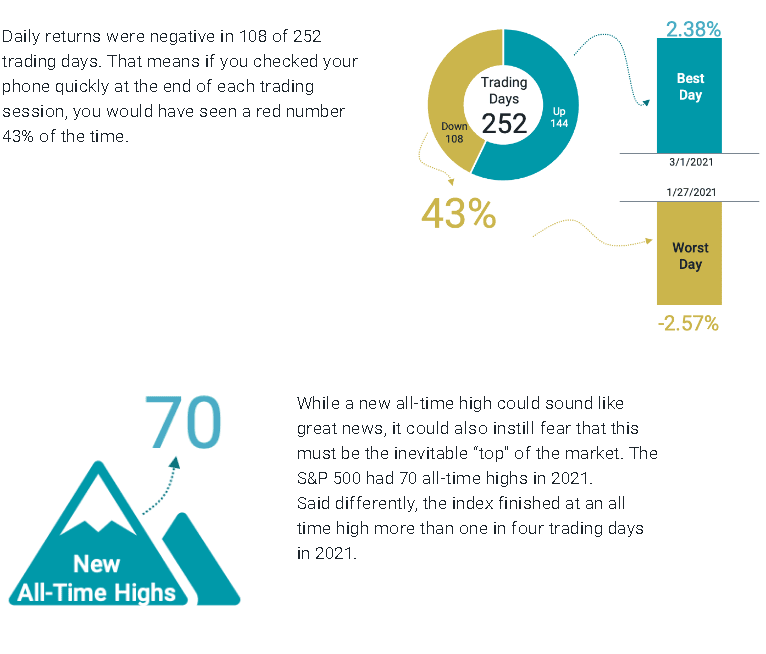
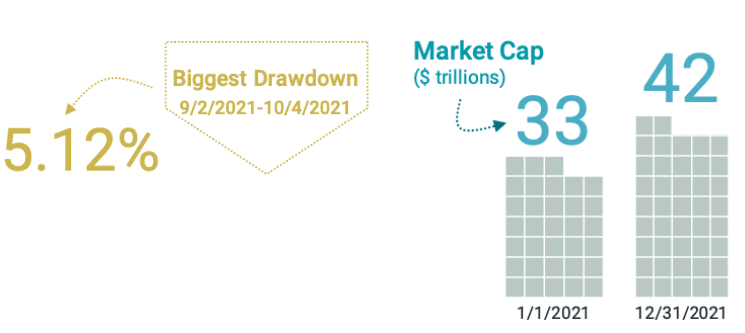
A recent downturn? Some may see it as an opportunity to buy, while others may worry that it is just the beginning of a much larger pullback. The most significant drawdown in 2021 was a little over 5%, while the index finished up 28.7% for the year. To put this into context, over the last 20 years, the average maximum intra-year decline (drawdown from previous high) for the S&P 500 Index was approximately 15%, while annualized returns over this 20-year period were 9.5%.
Data from 1/1/2021 - 12/31/2021. Source: Bloomberg and Avantis Investors. Past performance is no guarantee of future results.
Summing Up 2021
A year may seem like a long time, but it really isn't in the context of an average investor’s investment horizon.
In each of the examples from last year, we shouldn’t discount the role that noise played in returns—and our perception of them—as we work to design an asset allocation that may improve our chances of reaching our long-term goals and one that we are comfortable sticking with during anxious times.
We believe this philosophy should apply just as much in 2022—and beyond—as in 2021.
Data from 9/30/1970 - 9/30/2021. Sources: FRED, Federal Reserve Bank of St. Louis and U.S. Bureau of Labor Statistics, Avantis Investors. Finance and technology portfolios are from Ken French’s Data Library based on Compustat definitions for industry groupings. Past performance is no guarantee of future results.
Glossary
S&P 500® Index. A market-capitalization-weighted index of the 500 largest U.S. publicly traded companies. The index is widely regarded as the best gauge of large-cap U.S. equities.
This material has been prepared for educational purposes only. It is not intended to provide, and should not be relied upon for, investment, accounting, legal or tax advice.
Investment return and principal value of security investments will fluctuate. The value at the time of redemption may be more or less than the original cost. Past performance is no guarantee of future results.
Diversification does not assure a profit nor does it protect against loss of principal.
It is not possible to invest directly in an index.