The Stories of 2023

How could we sum up the market in a year like 2023? If given only a word, resilient might do.
The year began with many reasons that investors might doubt the market. There was anxiety over high inflation, rising interest rates, and widespread “hard landing” and recession forecasts.
Later, we endured regional banking turmoil and witnessed the onset of war in the Middle East. Yet, despite it all, the market delivered big, with the S&P 500® Index returning over 26%.
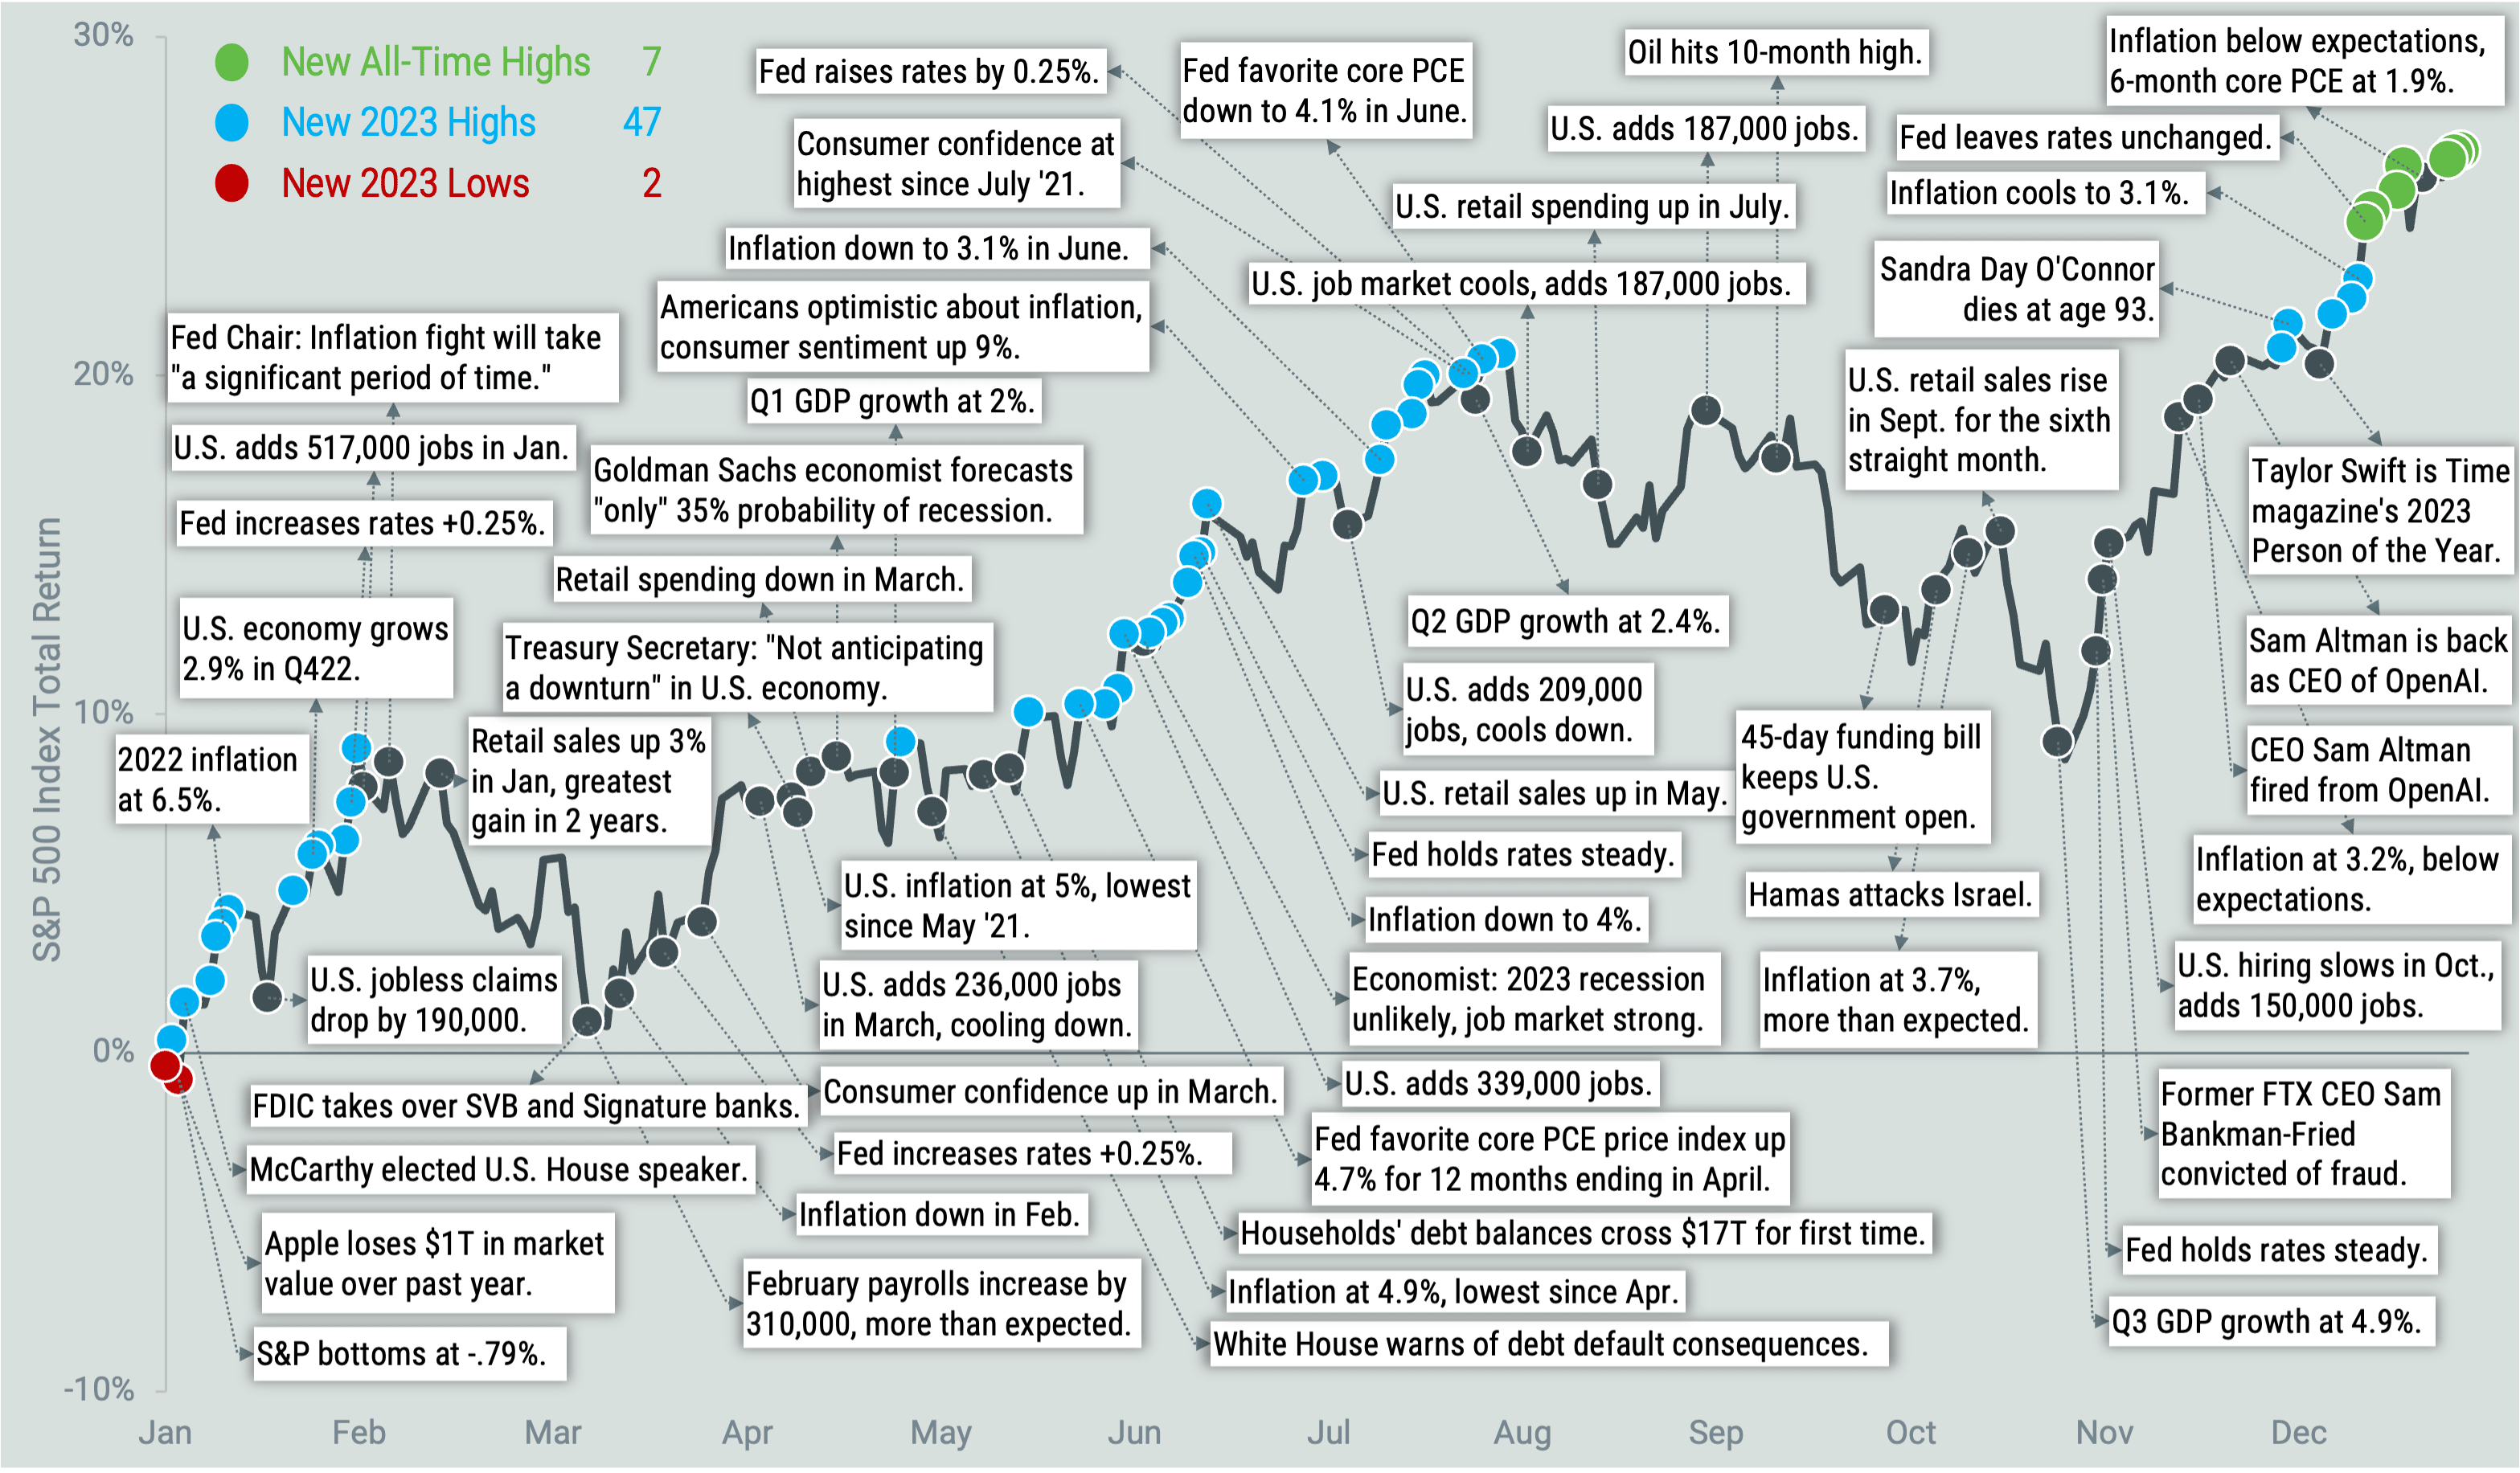
For a more in-depth trip down memory lane, Figure 1 captures as much as we could fit of the good and not-so-good news from 2023, presented against the cumulative return of the S&P 500. Market highs and lows are highlighted to illustrate further what a tremendous year it was (blue and red dots for highs and lows and green for new all-time highs).
Amazingly, a dollar tracking the index beginning with the start of the year would have reached the low mark by January 5 and experienced 47 new highs by the end of 2023.
Figure 1 | S&P 500 Index Return and Headlines in 2023
Data from 1/1/2023 - 12/29/2023. Source: FactSet, Avantis Investors. Past performance is no guarantee of future results.
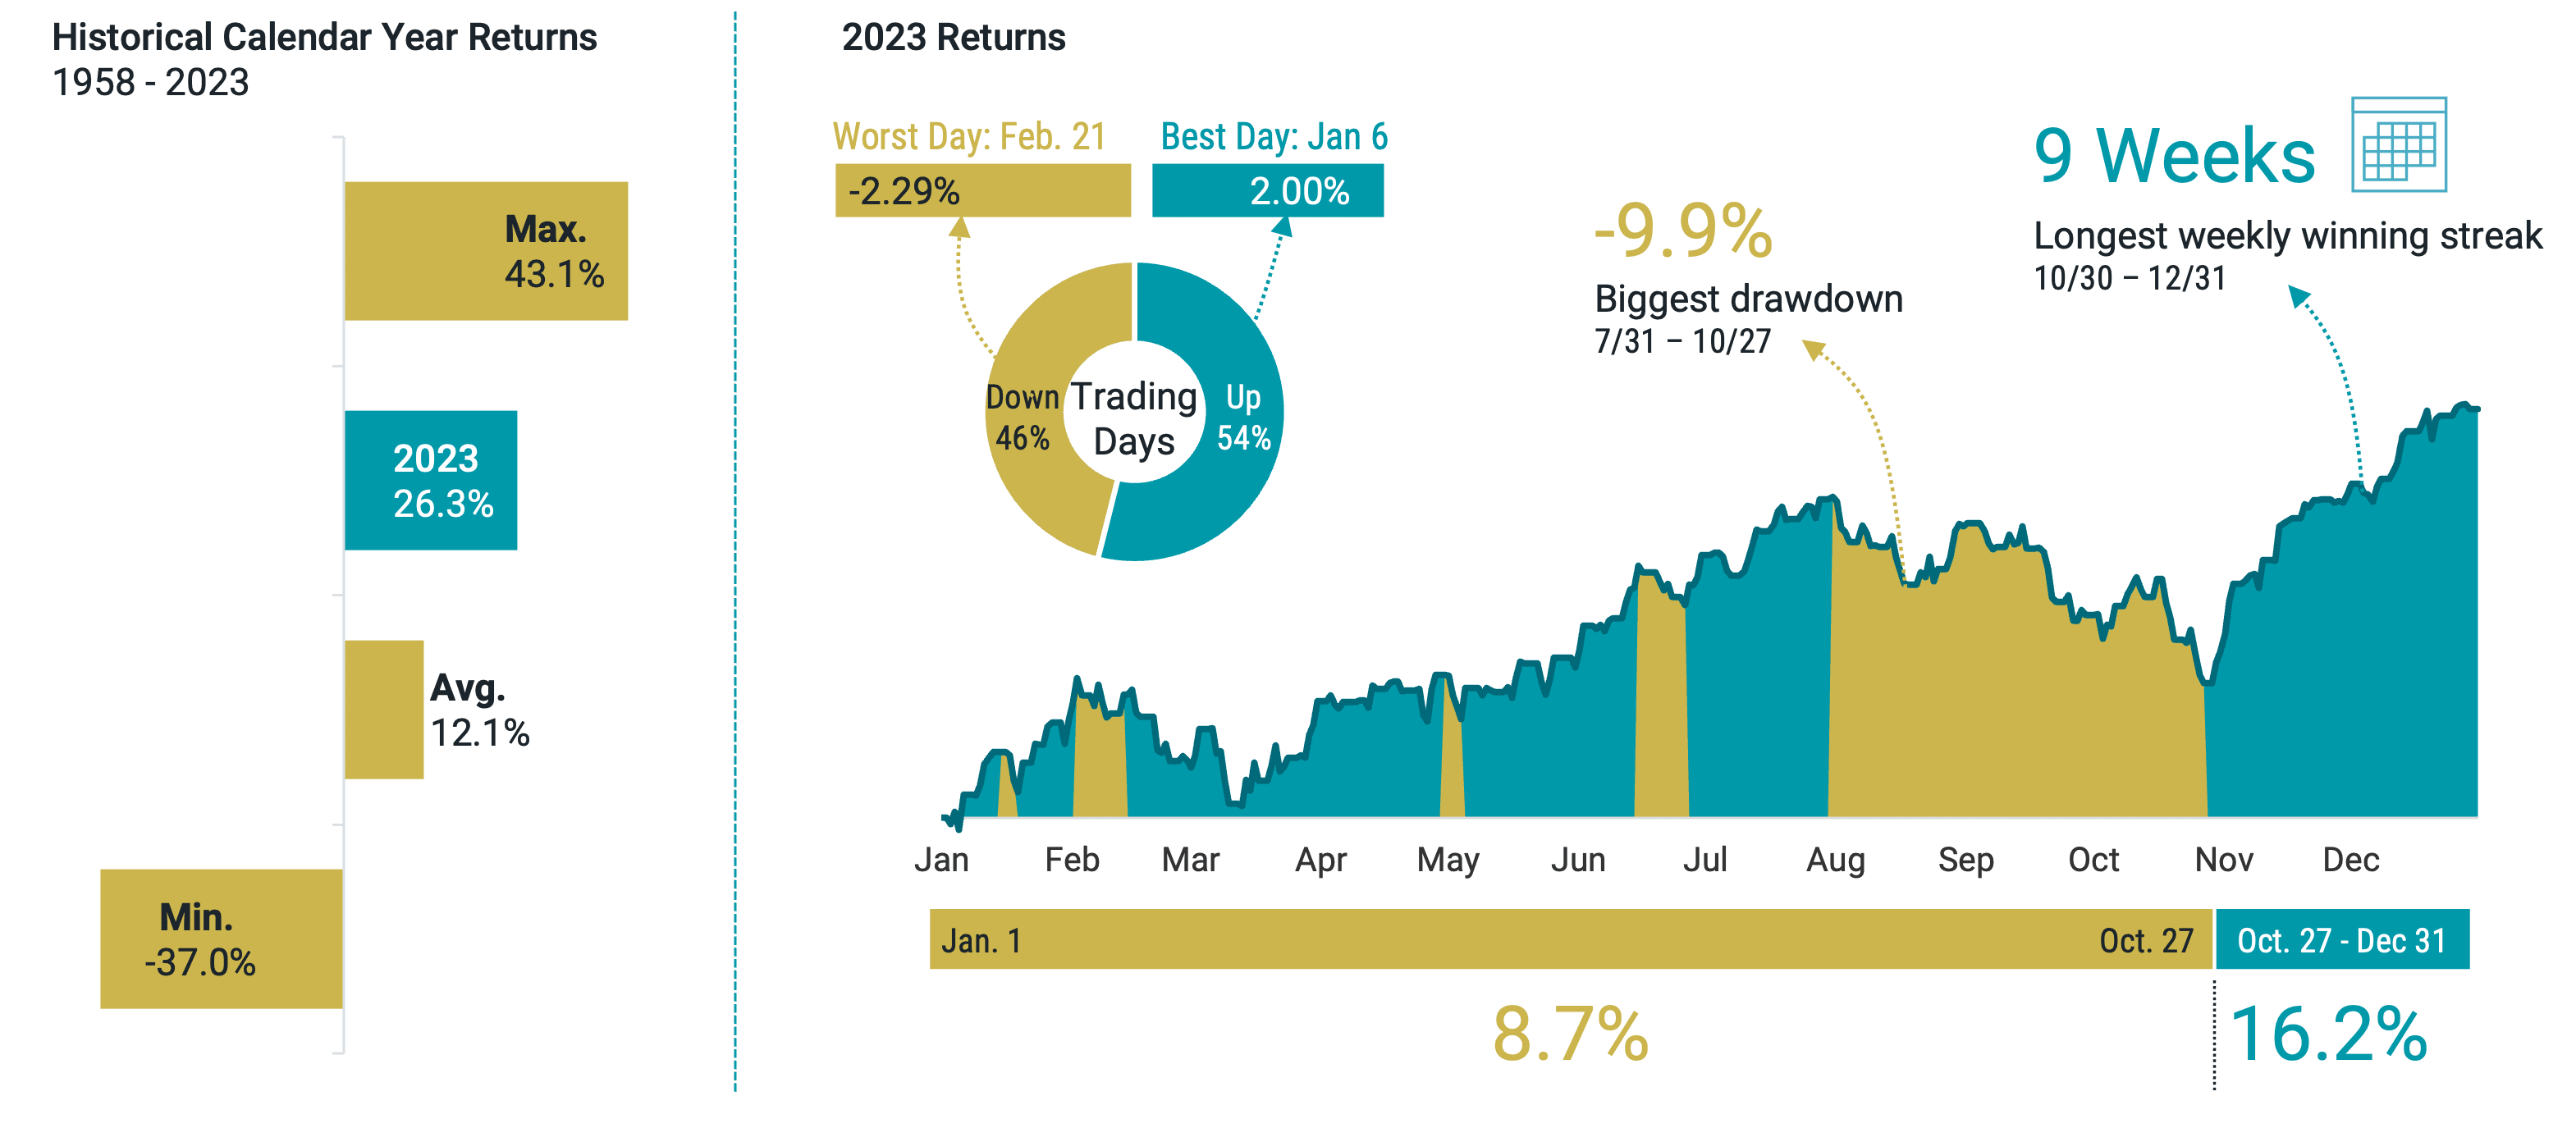
To offer a sense of just how impressive the market return was in 2023, if you compare it against the average of all calendar year returns since the S&P 500 was incepted in 1957, it’s more than double (26.3% vs. 12.1%) as shown in the left panel of Figure 2.
What we can’t see in the 2023 total return figure is that the day-to-day experience for investors was more complex.
The right panel of Figure 2 shows a few more statistics for the S&P 500 in 2023. Even in a big up year, there were plenty of ups and downs.
Missing out on short periods in the market, like the last nine weeks when stocks rose 16%, could have led to much lower returns (8.7% YTD as of Oct. 27 vs. 26.3% by year end) — another reminder of how trying to time the market is unlikely to leave us better off than just staying the course.
Figure 2 | S&P 500 Index by the Numbers
Calendar year return data from 1/1/1958 - 12/31/2023. The S&P 500® Index incepted in March 1957. Remaining data from 1/1/2023 - 12/31/2023. Source: Bloomberg and Avantis Investors. Past performance is no guarantee of future results.
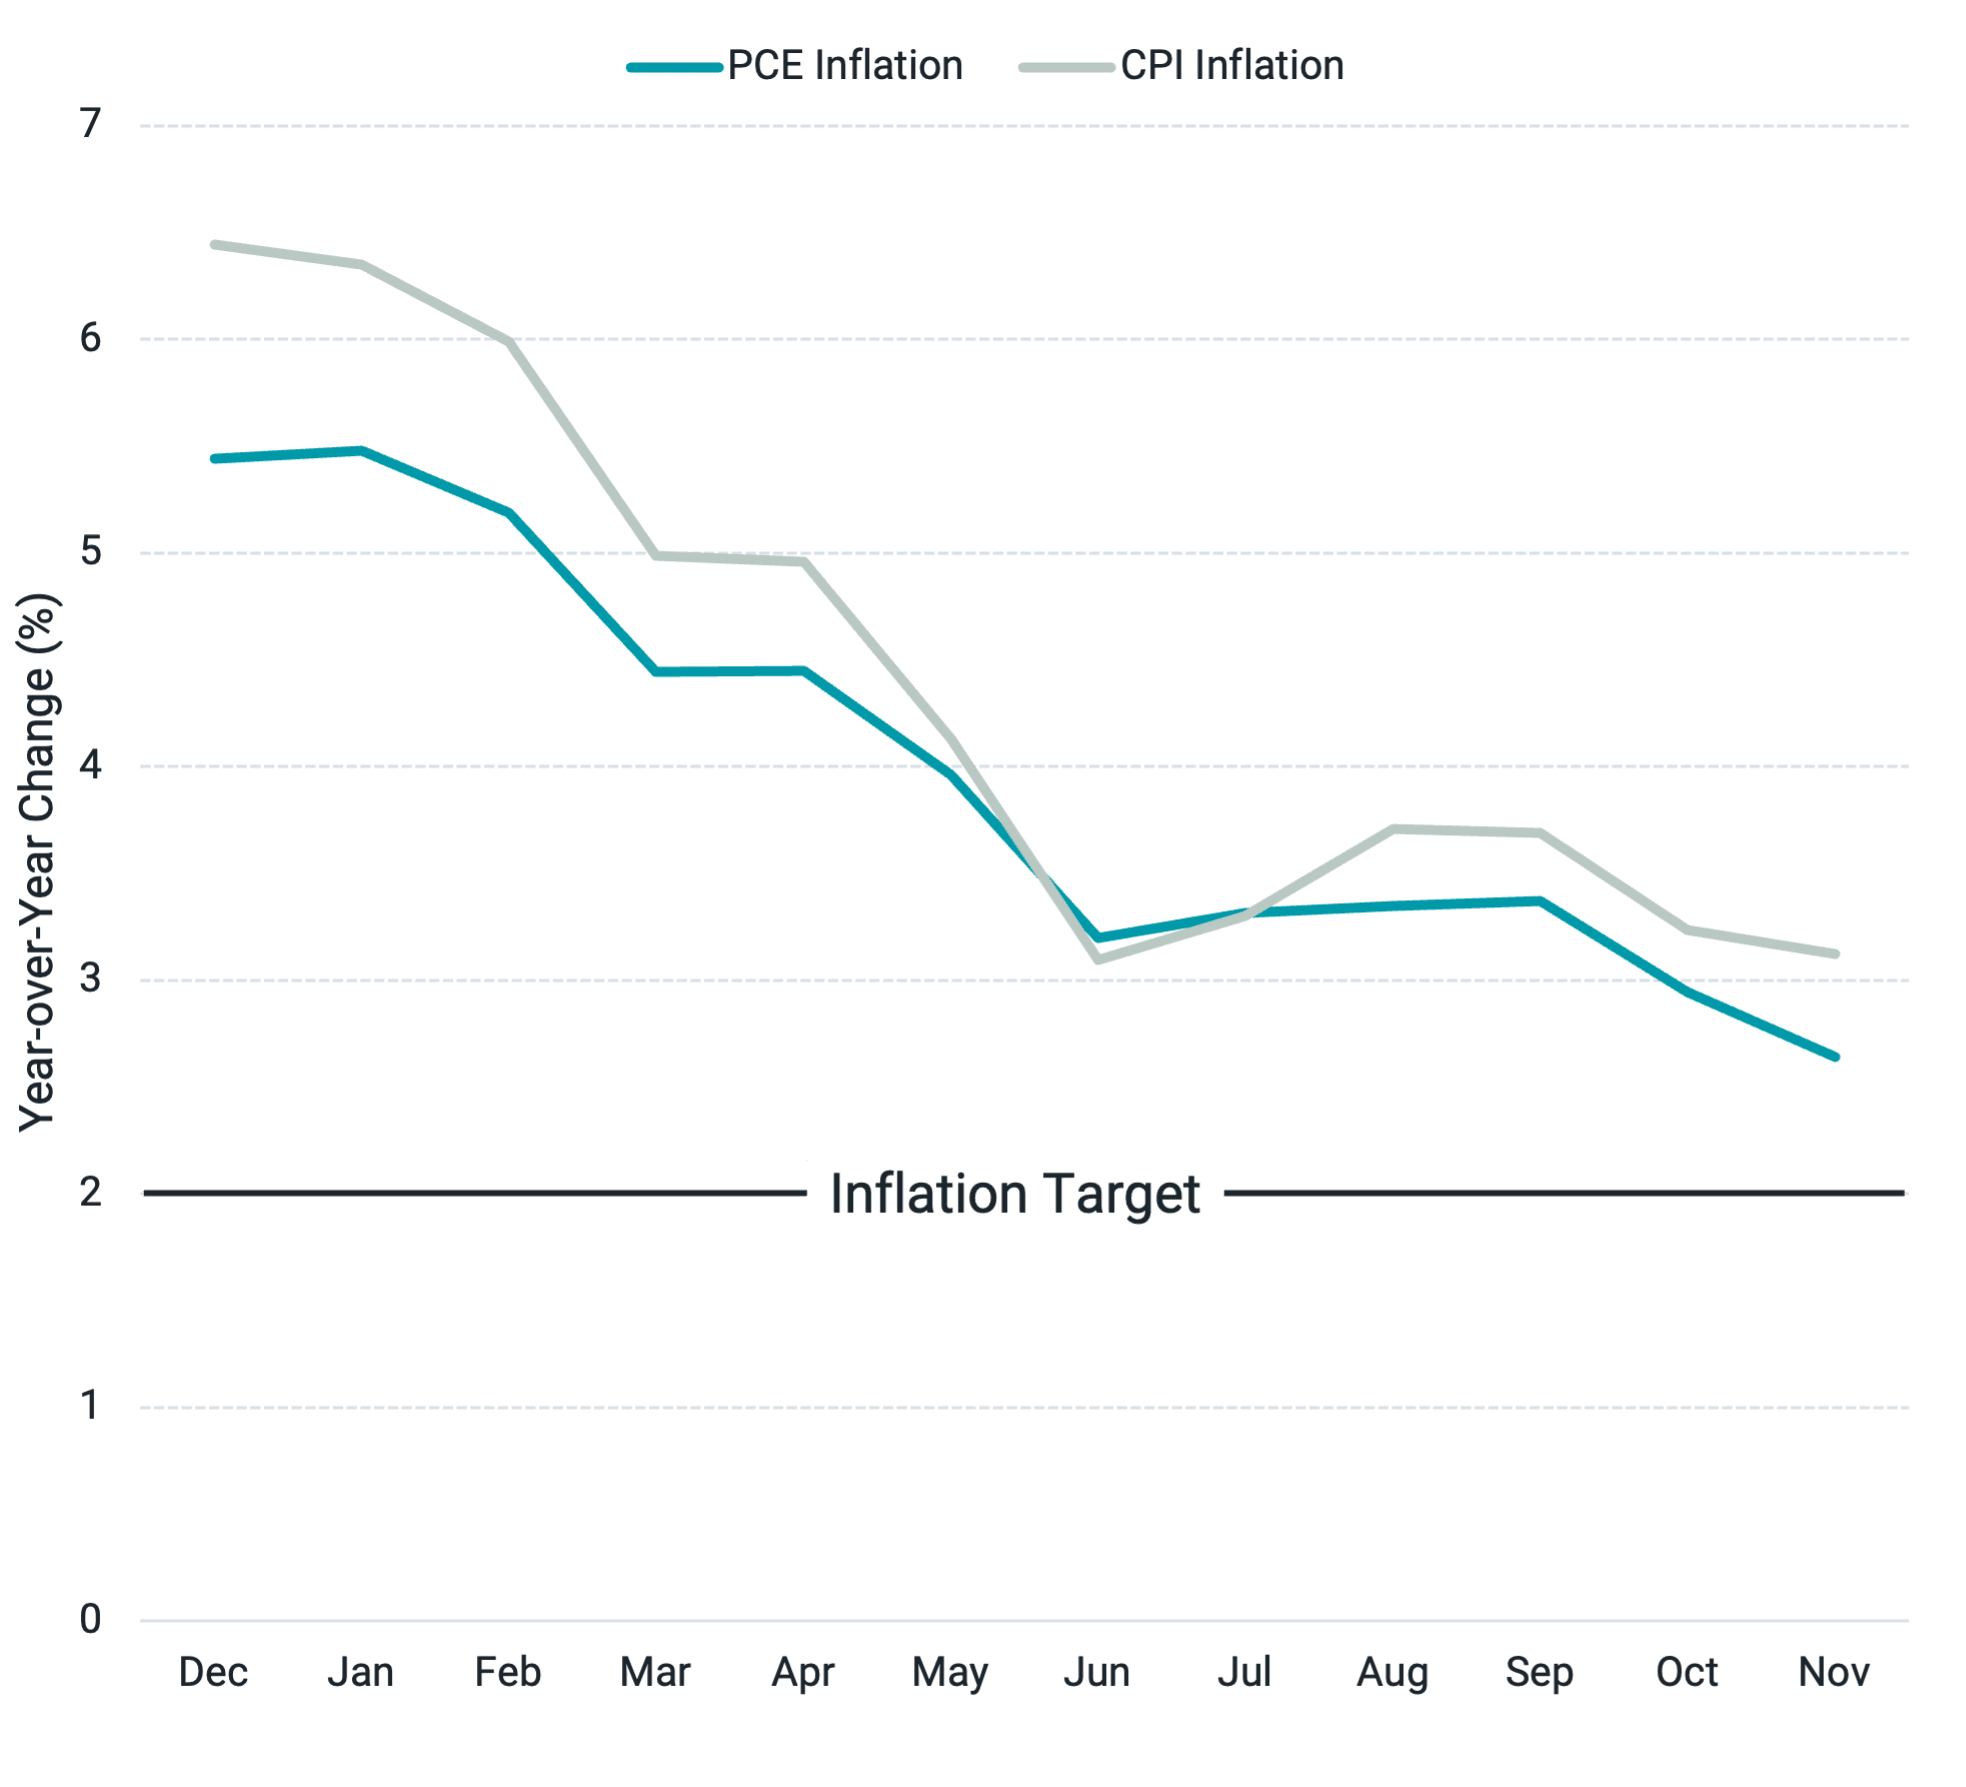
Beyond stock returns, a few other storylines stood out in 2023. Coming into last January, the rate of inflation still stood around three times the Federal Reserve’s (Fed’s) 2% target. Over the year, the gap between actual and target inflation narrowed considerably.
Figure 3 paints the picture, presenting two common measures of inflation: the Consumer Price Index (CPI) and Personal Consumption Expenditures (PCE) price index. Both measures show a similar trend over the year.
The Consumer Price Index (CPI) and Personal Consumption Expenditures Price Index (PCE) are two U.S. inflation metrics that use different methodologies, and therefore produce different estimates. The CPI measures the change in the out-of-pocket expenditures of all urban households. The PCE index measures the change in goods and services consumed by all households and nonprofit institutions serving those households.
Figure 3 | Inflation Closed in on the Fed’s Target Inflation Rate in 2023
Data from 12/1/2022 - 11/30/2023. Source: U.S. Bureau of Economic Analysis from FRED.
A few other recent milestones continued to inspire hope that inflation is coming under control. In November, the PCE index level fell from where it stood in October. We often hear inflation numbers reported in percentage change from the prior year.
In this case, we’re talking about the underlying price level measured by the index, which suggests prices declined in November (not just the rate of change). This marked the first time the index registered a month-over-month decline since early 2020. Also notable: Core PCE, which excludes food and energy costs, increased by just 1.9% over the last six months. That’s just below the Fed’s target.
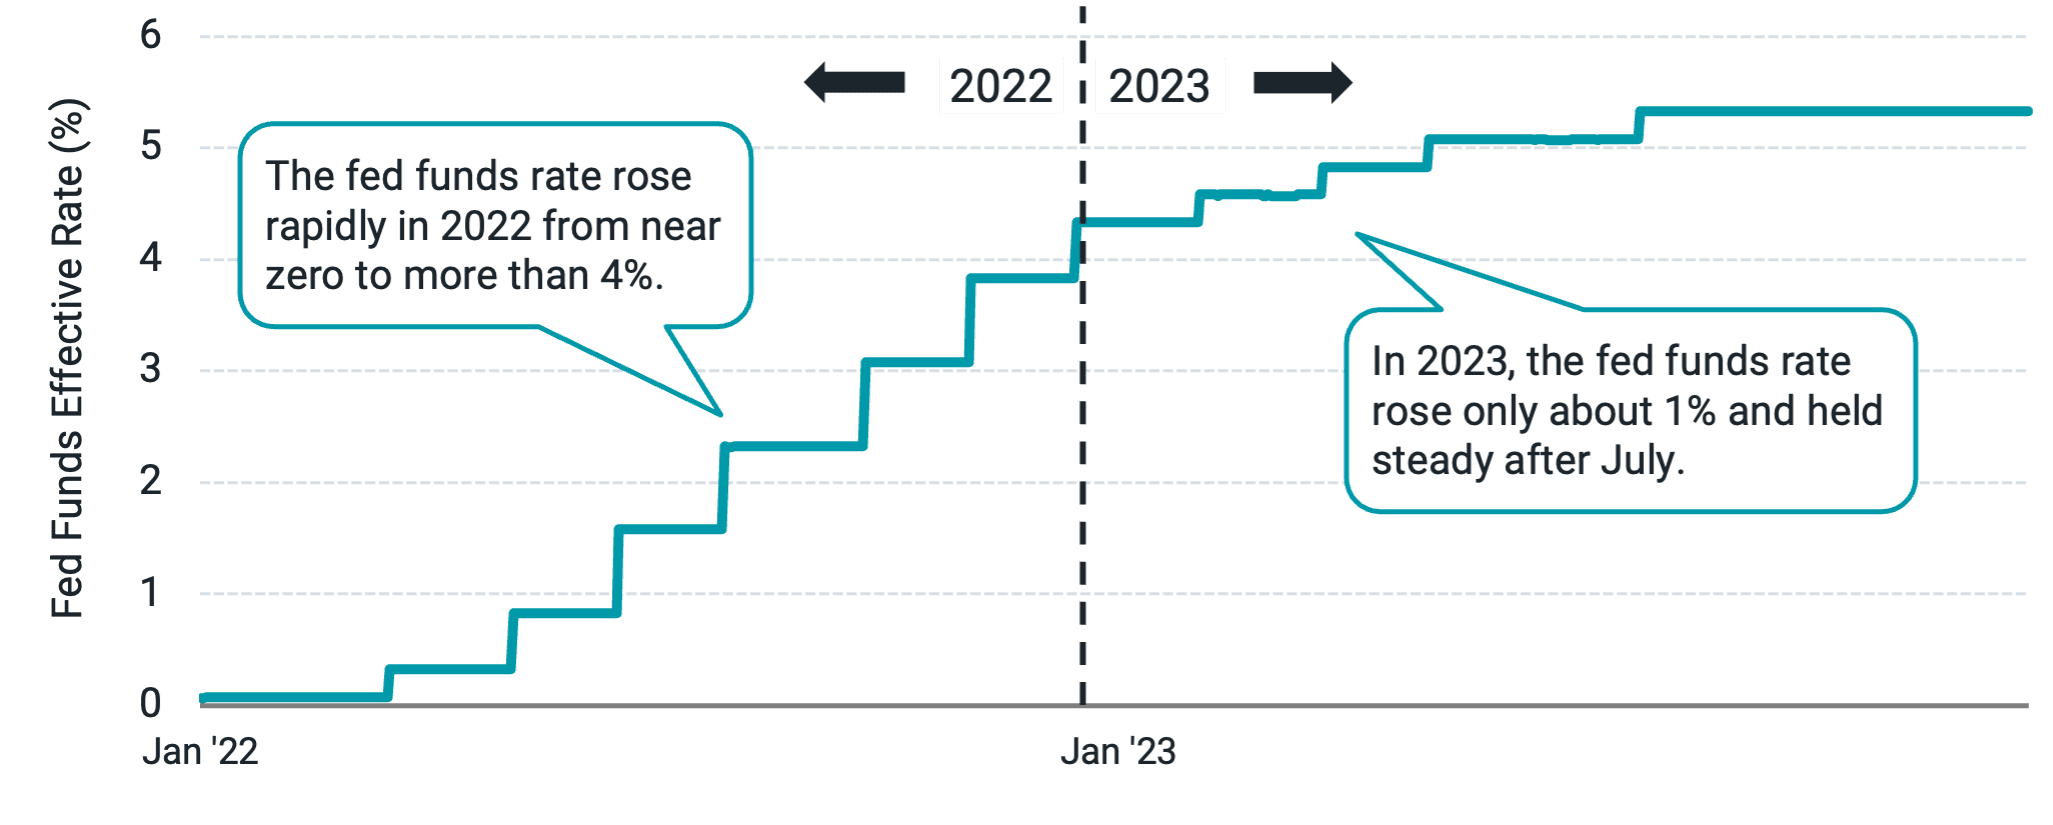
Of course, alongside inflation, investors paid close attention to the path of interest rates and the actions taken by the Fed in 2023. We can see in Figure 4 Panel A that the federal funds rate rose about 1% over the first seven months of 2023 to eclipse the 5% mark and held steady after that. Data from the start of 2022 highlights that 2023 looked quite different than 2022 when rates rose rapidly from near zero to above 4% in a single year.
Figure 4 | The Pace of Interest Rate Increases Slowed in 2023, with Rate Cuts Now Expected in 2024
Data from 1/1/2022 - 12/31/2023. Source: FRED.
Data from 10/1/2023 - 12/31/2023. Source: CME FedWatch.
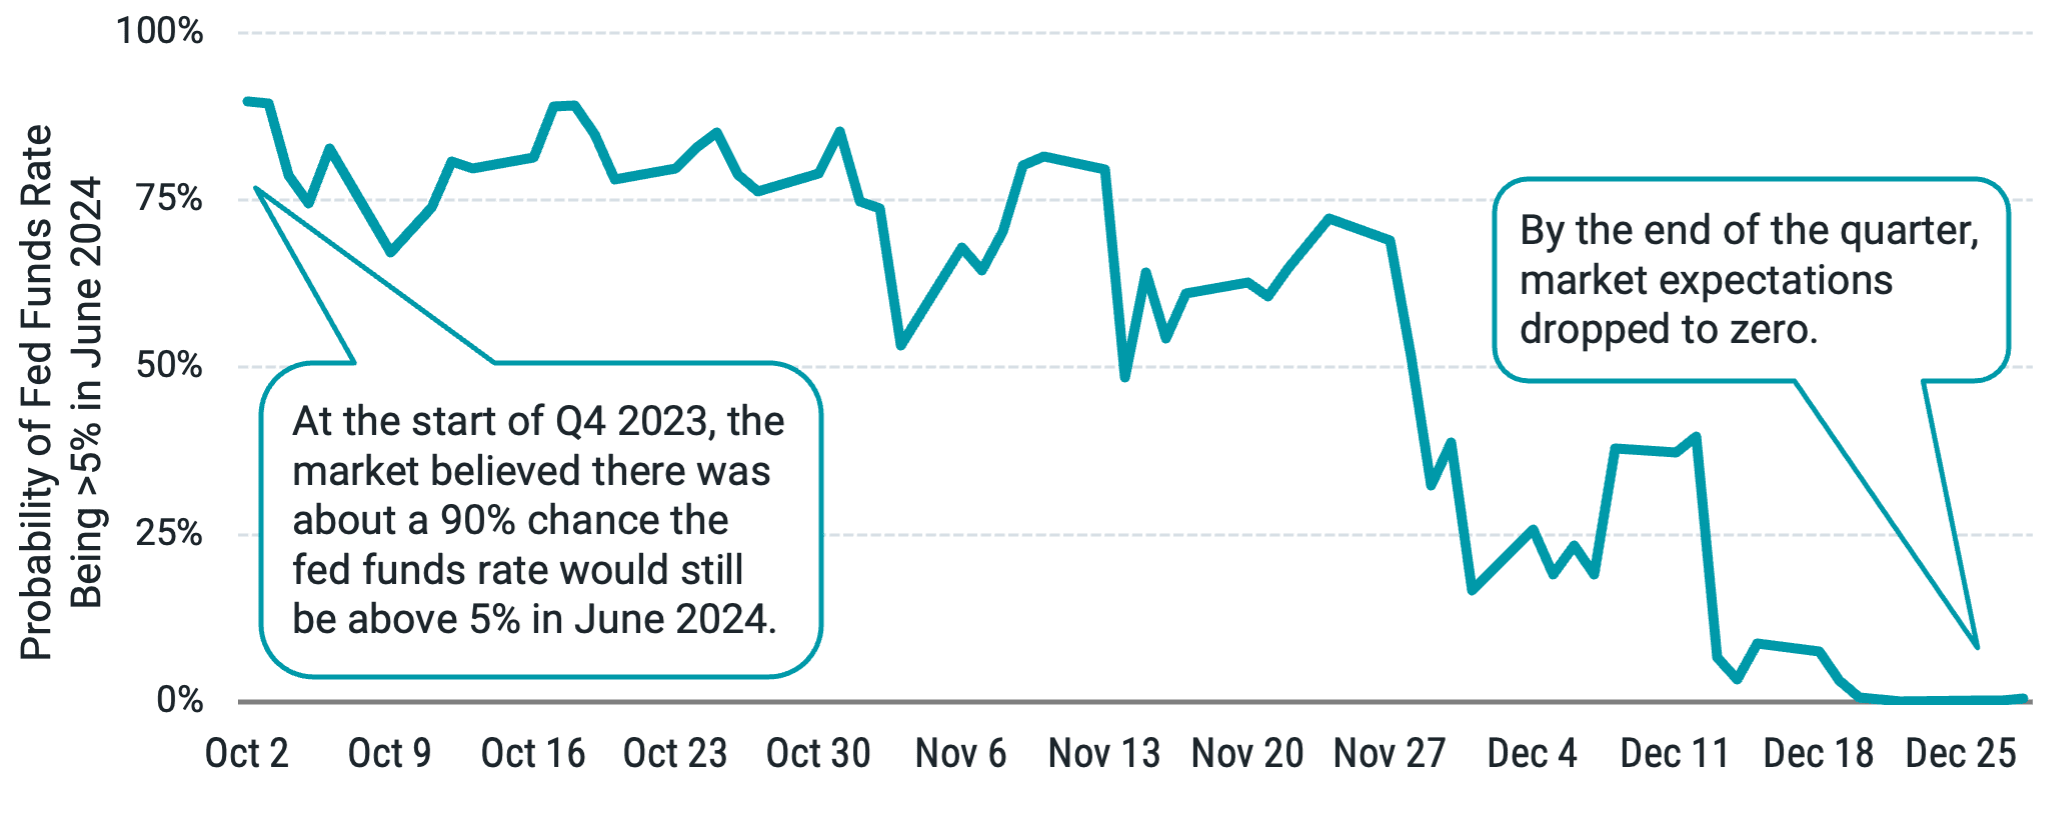
As we got closer to the end of the year, comments from the Fed suggested plans to shift in the other direction with likely rate cuts in 2024. Market-implied expectations for rates in 2024 shifted dramatically, particularly over the final three months of 2023.
Figure 4 Panel B shows that at the start of the fourth quarter, the market placed about a 90% chance on rates being above 5% in June 2024 (as implied by prices on fed futures contracts). By December, that expectation effectively dropped to zero. In other words, the market is now pricing in rate cuts to begin in the first half of 2024 — illustrating a remarkable shift in expectations.
A year ago, few predicted that the Fed could keep inflation in check and begin to cut rates without causing economic recession. The fact that we have yet to see a recession suggests that our earlier “resilient” descriptor can also be applied to the economy.
Taken altogether, these stories from 2023 — big returns from stocks, improving inflation, a slowing pace of rate hikes, and avoiding recession — highlight what a remarkable year it was. It was a year of so many memorable and unexpected stories and news events, but also one that offered powerful lessons for investors.
There will always be noise and distractions that can challenge you to stay invested in your financial plan. There will also be times when many predict market declines with no shortage of compelling arguments for why you should heed these warnings. Doing so in 2023 would likely have done far more harm than good.
If we stay focused on our long-term goals and the fact that our financial plan can account for the ups and downs, we will inevitably see in markets, we can be better prepared to tune out the noise in the short term (and maybe experience less stress about our portfolios along the way).
Those who held that philosophy throughout 2023 were likely rewarded. We think that approach is just as important in 2024 and the future.
Explore More Insights
Glossary
Consumer Price Index (CPI): CPI is the most commonly used statistic to measure inflation in the U.S. economy. Sometimes referred to as headline CPI, it reflects price changes from the consumer's perspective. It's a U.S. government (Bureau of Labor Statistics) index derived from detailed consumer spending information. Changes in CPI measure price changes in a market basket of consumer goods and services such as gas, food, clothing, and cars. Core CPI excludes food and energy prices, which tend to be volatile.
Federal Funds Effective Rate: A calculation of the effective median interest rate of overnight federal funds transactions during the previous business day.
Federal Funds Rate: An overnight interest rate banks charge each other for loans. More specifically, it's the interest rate charged by banks with excess reserves at a Federal Reserve district bank to banks needing overnight loans to meet reserve requirements. It's an interest rate that's mentioned frequently within the context of the Federal Reserve's interest rate policies. The Federal Reserve's Open Market Committee sets a target for the federal funds rate (which is a key benchmark for all short-term interest rates, especially in the money markets), which it then supports/strives for with its open market operations (buying or selling government securities).
Fed Futures Contracts: An agreement to buy or sell a specific amount of a commodity or financial instrument at a particular price on a stipulated future date, based on the federal funds rate. Futures contracts are typically used as a hedging/risk management tool in portfolio management.
Federal Reserve (Fed): The Fed is the U.S. central bank, responsible for monetary policies affecting the U.S. financial system and the economy.
Gross Domestic Product (GDP): A measure of the total economic output in goods and services for an economy.
S&P 500® Index: A market-capitalization-weighted index of the 500 largest U.S. publicly traded companies. The index is widely regarded as the best gauge of large-cap U.S. equities.
Investment return and principal value of security investments will fluctuate. The value at the time of redemption may be more or less than the original cost. Past performance is no guarantee of future results.
This material has been prepared for educational purposes only. It is not intended to provide, and should not be relied upon for, investment, accounting, legal or tax advice.
The opinions expressed are those of the portfolio team and are no guarantee of the future performance of any Avantis fund.
Contact Avantis Investors
inquiries@avantisinvestors.com
This website is intended for Institutional and Professional Investors, not Retail Investors.