Putting a Bow on 2022
2022 proved to be a year marked by numerous memorable events. Still, many investors might wish they could forget it, considering one prominent gauge of U.S. stock market performance — the S&P 500® Index — ended the year up from its 2022 low in October yet near bear market territory. In Figure 1 [PDF], we offer a look back across 2022, plotting the cumulative daily return for the S&P 500 along with a host of notable headlines. While the results for investors in 2022 may be disappointing, if we zoom out beyond this single year to think about all that has transpired since the start of 2020 and just before the onset of the COVID-19 pandemic, we are reminded of the remarkable resiliency of markets and the long-term opportunity for investors who stay the course.
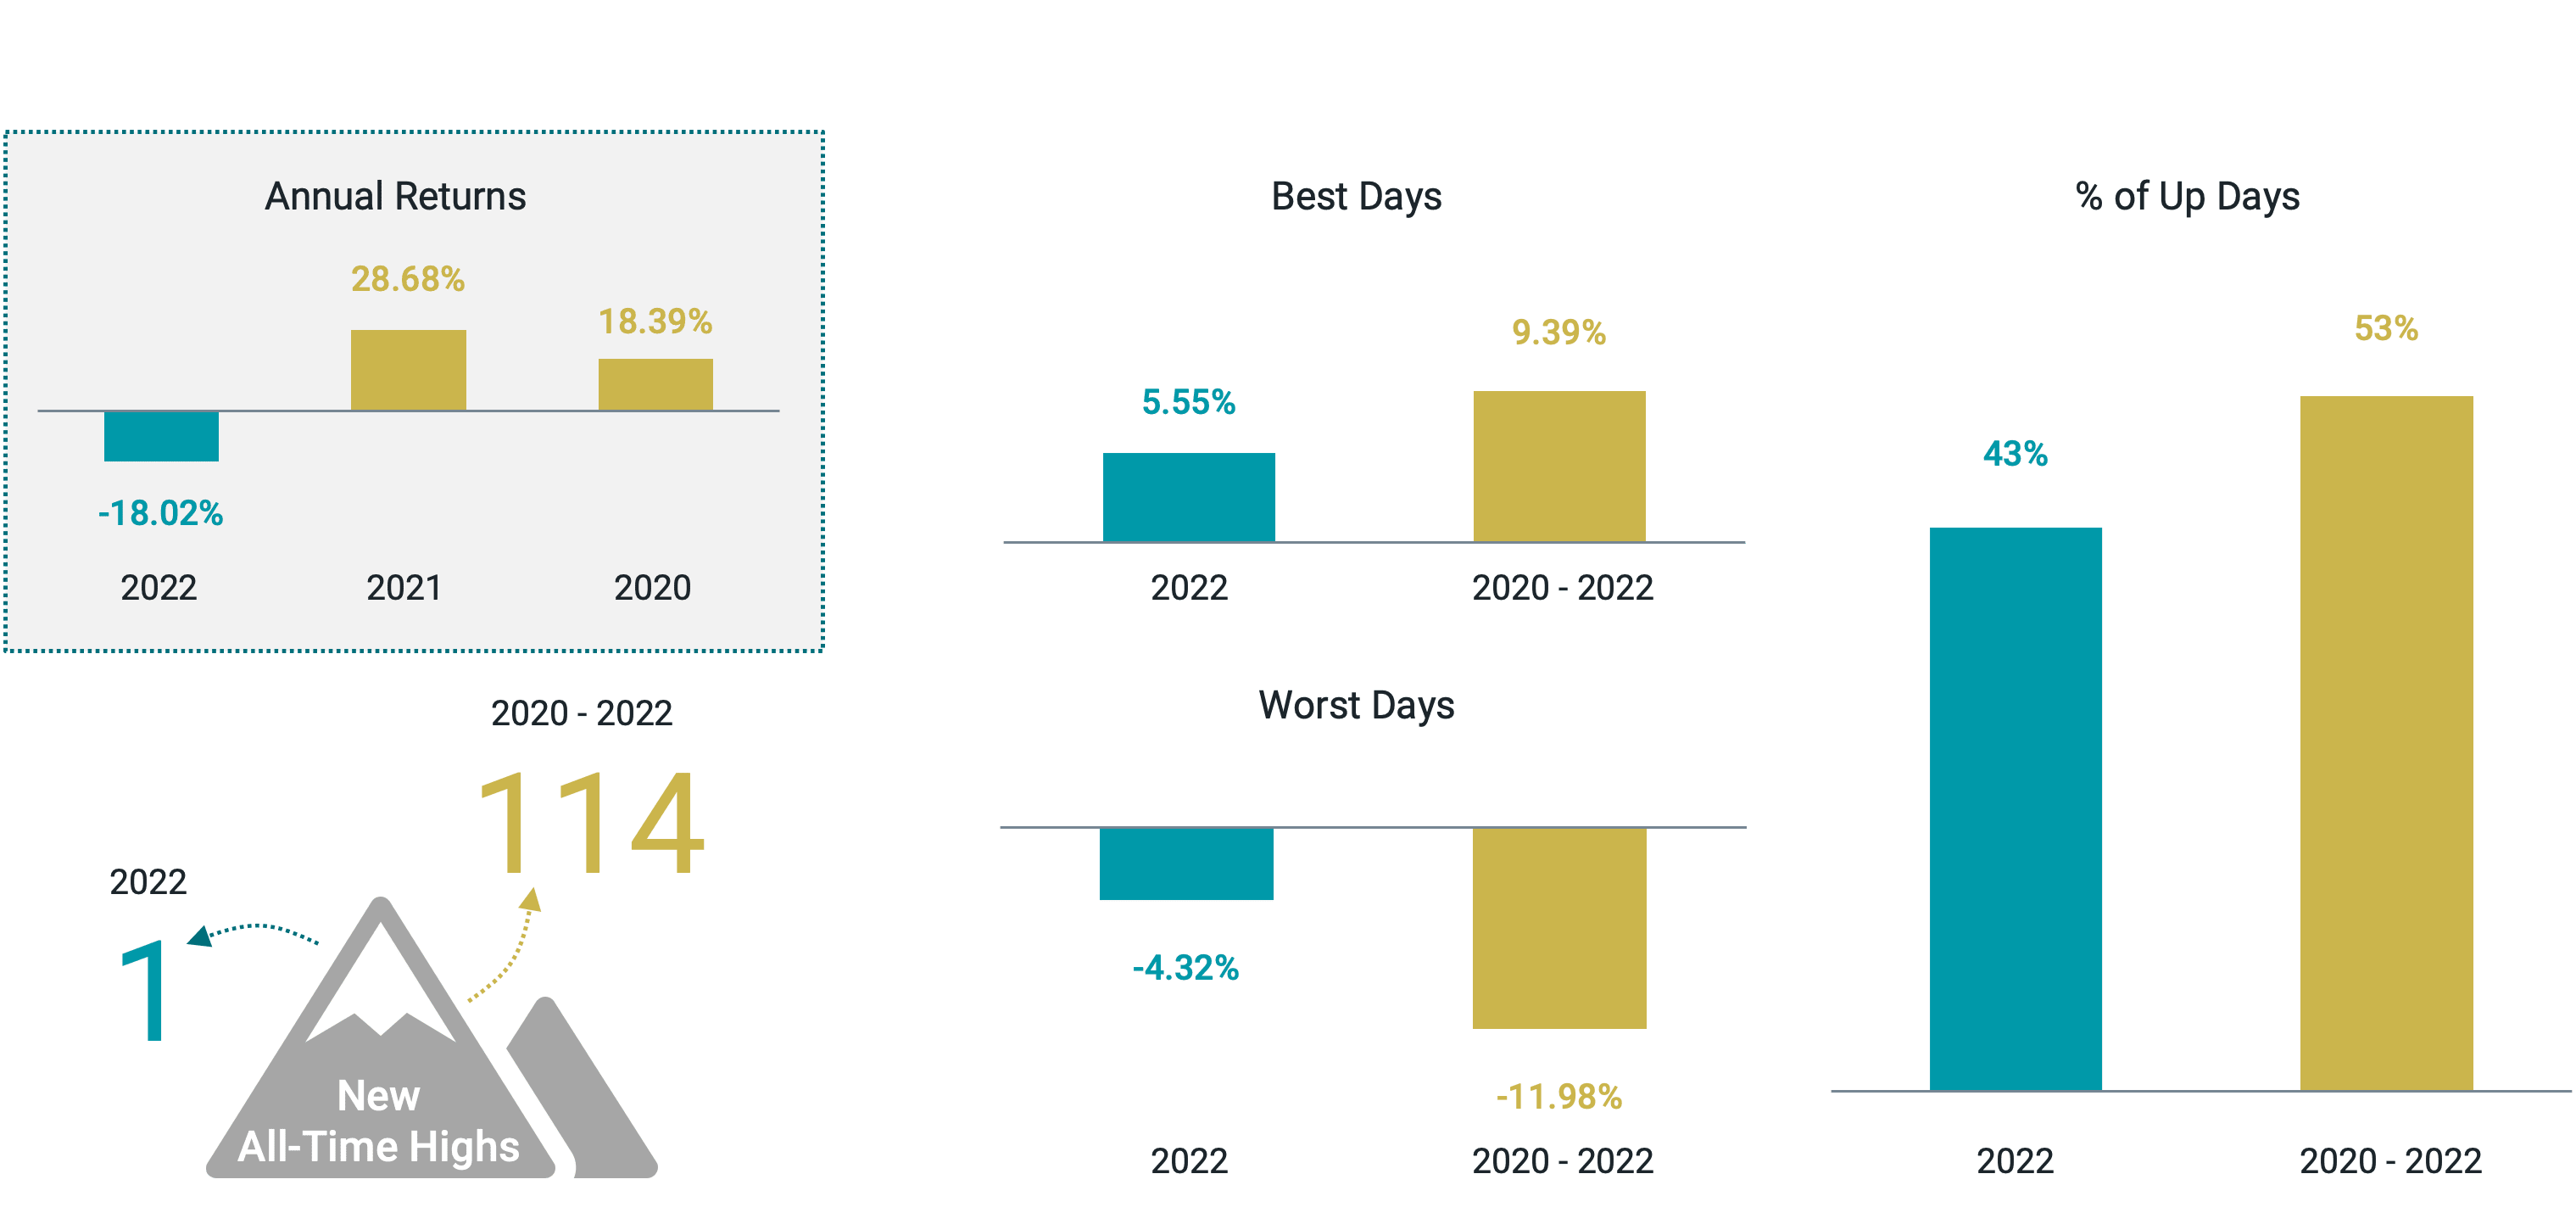
To paint the picture, we start by presenting a few statistics for the S&P 500 for the past three calendar years in Figure 2. Over the entire period, the index reached 114 all-time highs, but only one came in 2022 — on the first trading day of the year. Despite big gains in calendar years 2020 and 2021, only about half of the trading days over the three years delivered a positive return.
There were also large swings even within single trading days. The best days from the period offer a prime example of the speed at which markets can move and the risk of exiting the market during volatile times.
S&P 500® Index by the Numbers (2020-2022)

Data from 1/1/2020 – 12/31/2022. Source: Bloomberg, Avantis Investors. Past performance is no guarantee of future results.
Over these three years, there was, of course, plenty of news and changing conditions that contributed to market volatility. The pandemic, the ensuing economic shutdown, rising inflation after the restart, and the Federal Reserve's actions to fight it are just a few memorable examples.
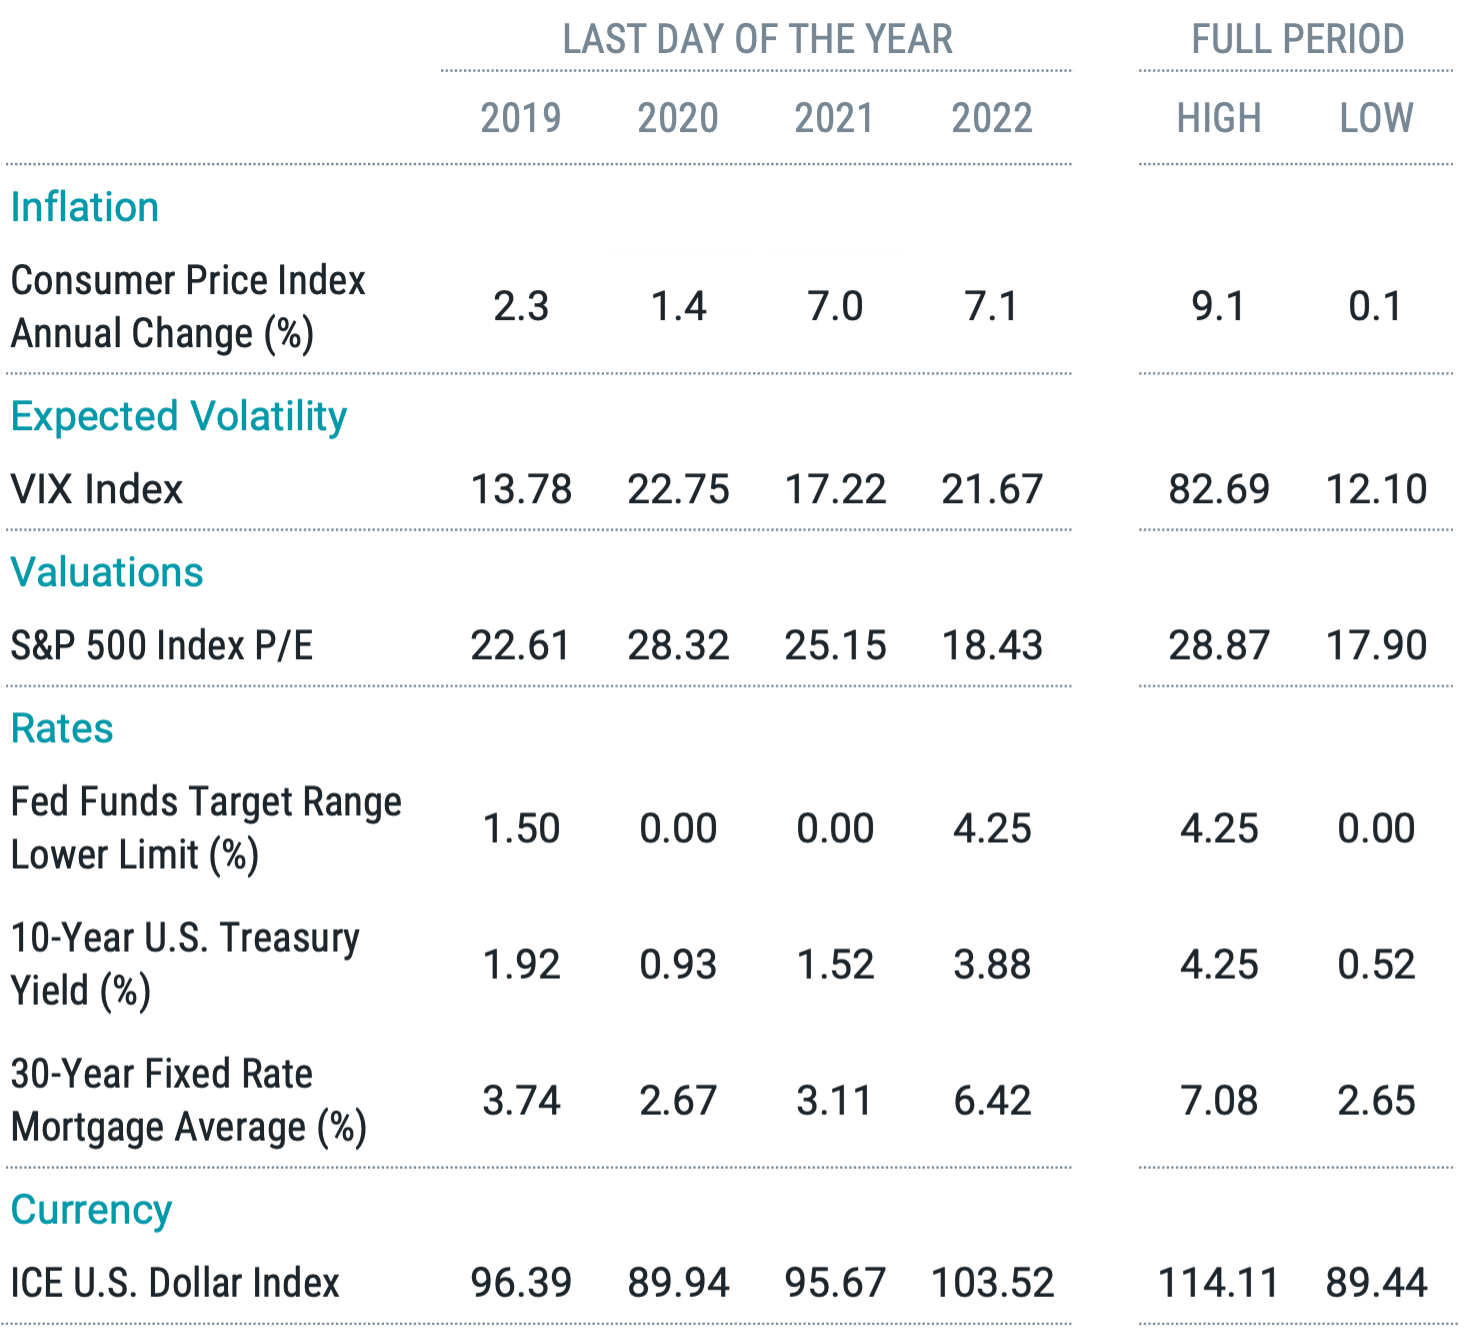
In Figure 3, we put the period in greater context by presenting a selection of notable statistics showing where each stood at the end of 2019 and each year since.
The data again highlight how quickly things can go in a different direction. We can see this by comparing the end of 2022 to the end of 2019. For example, looking beyond inflation, expectations for stock market volatility are higher today, valuations for S&P 500 companies are lower, and the federal funds rate target is markedly higher (see dates denoted by yellow in Figure 1), as is the 10-year Treasury yield.
The full-period highs and lows help to unmask that the changes were anything but linear. Between these three years, we saw times of much higher volatility, much higher stock valuations and much lower interest rates than we saw at the end of 2022. To offer a few more examples, consider that just within these three years, we saw the peak for negative-yielding non-U.S. debt, as several central banks in Europe and Japan set target rates below zero, and today we've seen that nearly fall to zero.
Figure 3 | Select Market Statistics

Data from 12/31/2019 – 12/31/2022. Source: Bloomberg, Federal Reserve Board of Governors (FRED) and the U.S. Bureau of Labor Statistics. Consumer Price Index (CPI) is derived from detailed consumer spending information. Changes in CPI measure price changes in a market basket of consumer goods and services such as gas, food, clothing, and cars. The VIX Index tracks the expected 30-day future volatility of the S&P 500. P/E, or price-to-earnings ratio, is a stock’s price per share divided by its annual earnings per share. Yield is the rate of return for bonds and other fixed income instruments. ICE U.S. Dollar Index is a measure of the value of the U.S. dollar relative to a basket of foreign currencies such as the Euro, Swiss franc, Japanese yen, Canadian dollar, British pound and Swedish krona. Past performance is no guarantee of future results.
The U.S. dollar (USD) also strengthened over much of the period during a time of rising rates in the U.S., which weighed on international stock returns for U.S. investors. However, a softening dollar to close 2022 played a role in the S&P 500 underperforming non-U.S. stocks (MSCI ACWI ex U.S. Index) on the year by more than 3% — a result that may surprise investors who have watched the U.S. market win more often than not in recent periods.
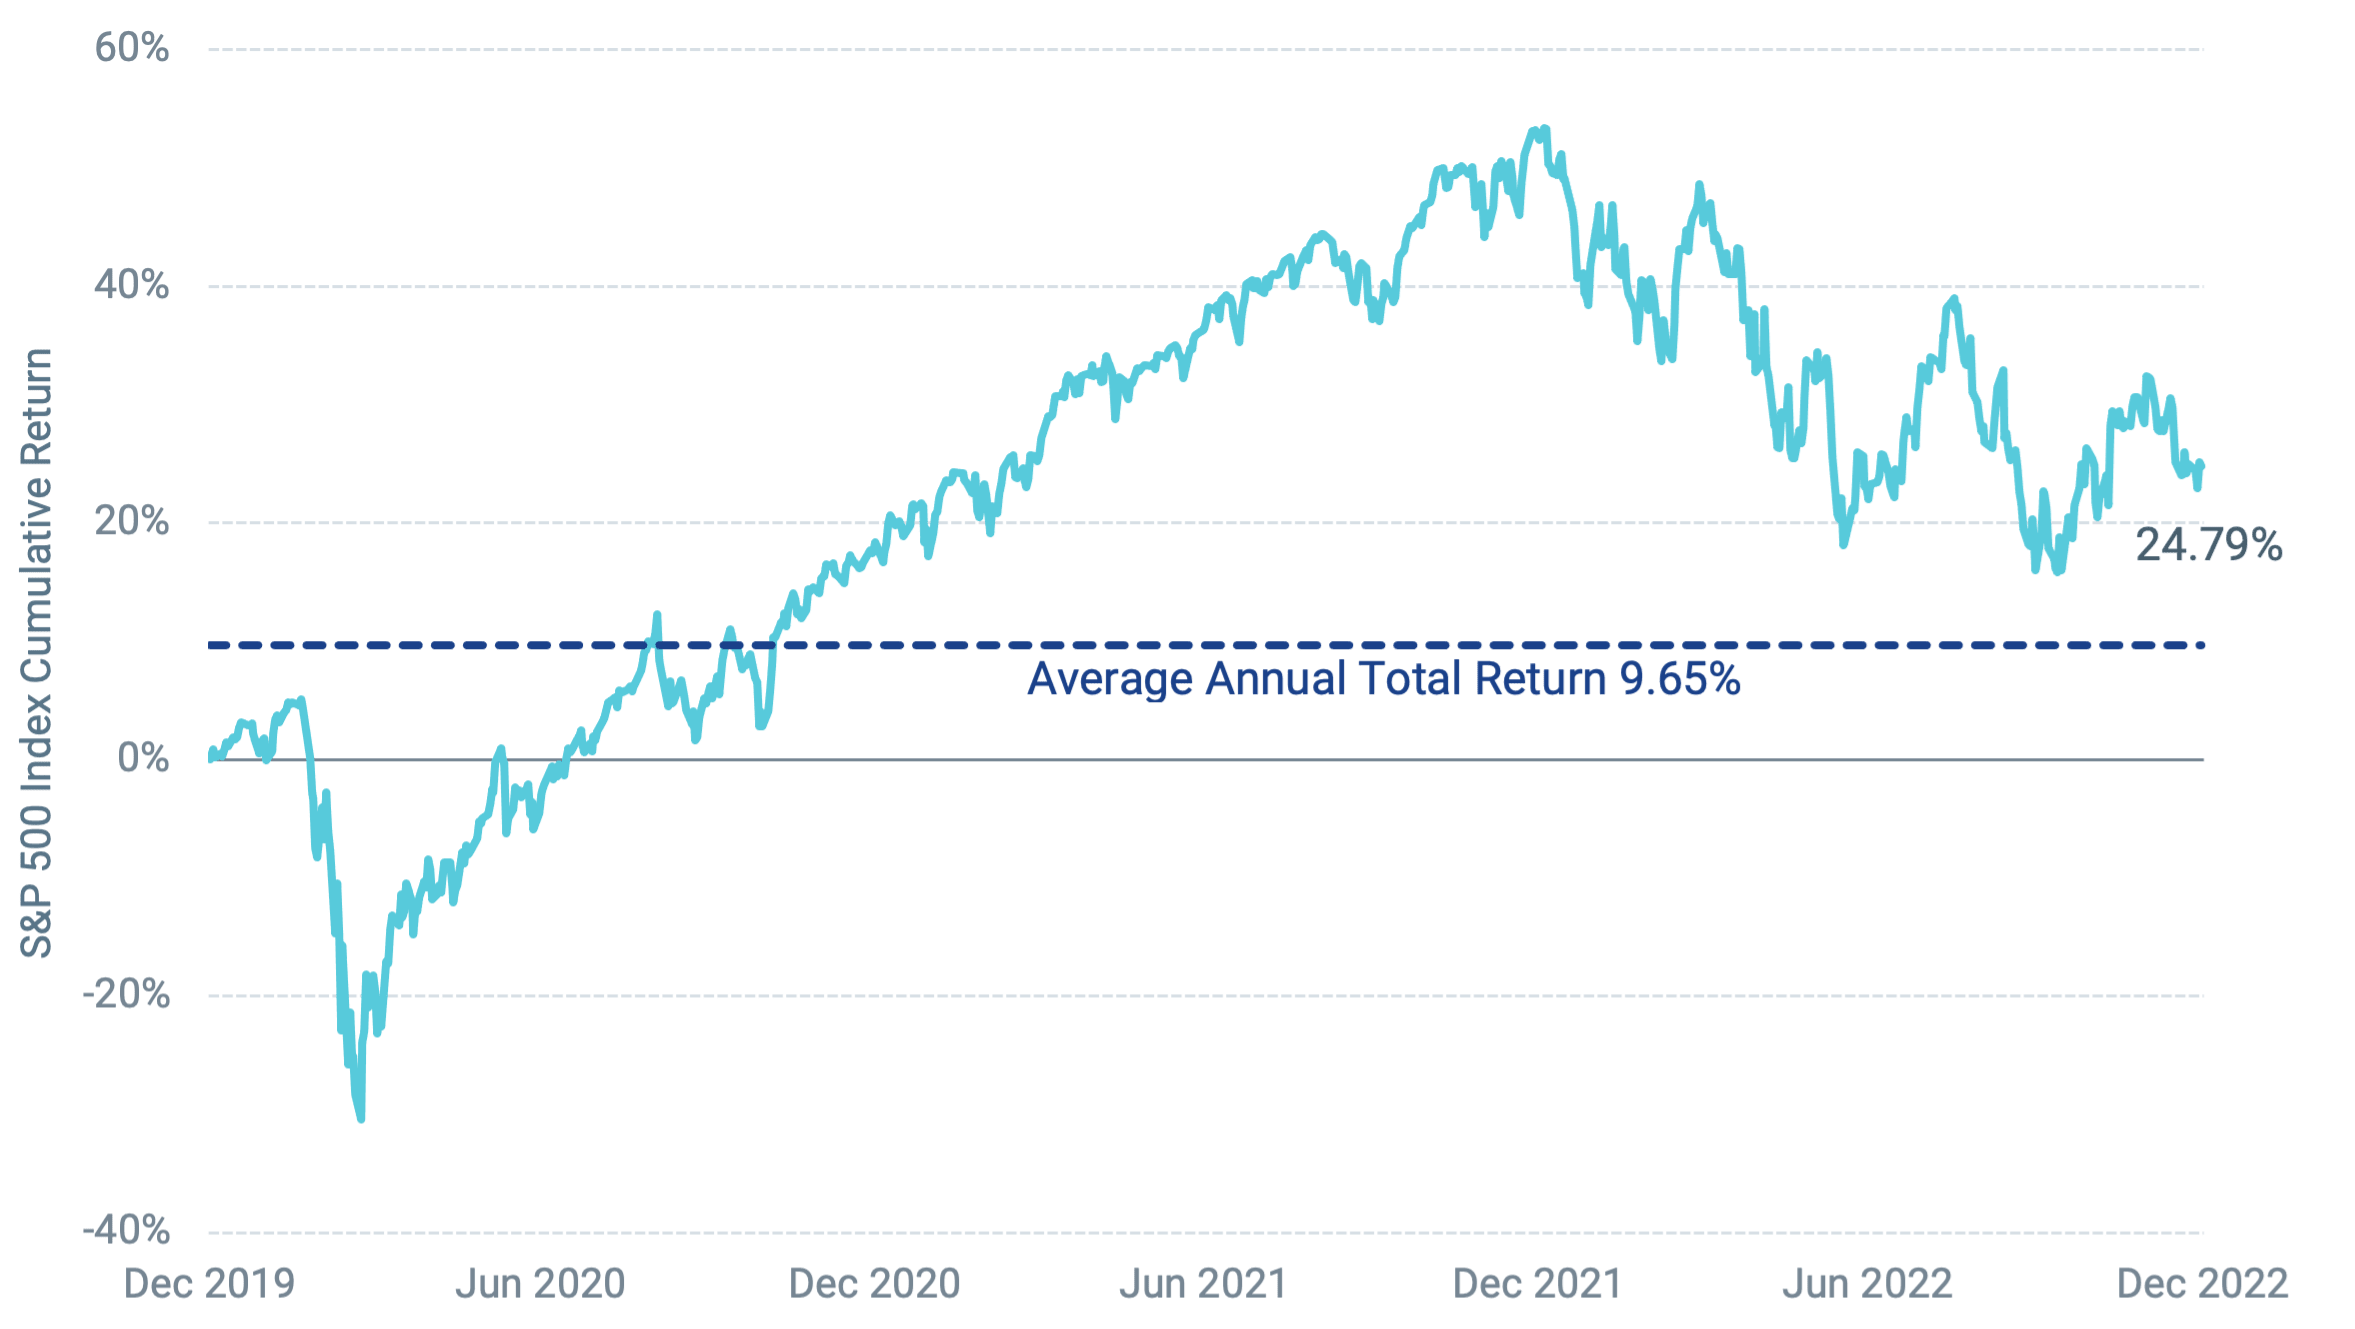
All these statistics in Figures 2 and 3 highlight that investors and markets have endured a lot over the past three years. If you were approached at the start of 2020 and told what would happen over the next three years, would you have wanted to invest in stocks? Despite a down year in 2022, if you had held all the stocks in the S&P 500 Index for the full three years, you would have earned a cumulative return of nearly 25% with an average annual return of almost 10%. That's a deal many investors would have likely accepted if given the foresight of the realized returns of the market to come.
Figure 4 offers a few additional takeaways. The first is that if we give too much importance to a single year, we may feel that today's picture is bleaker than the reality for a long-term investor. One year is a relatively short period in the context of an average investor's investment horizon.
Further, we can take some comfort in knowing that markets have overcome many tough times in the past and, over the long term, have played an essential role in helping investors achieve their long-term investment goals. Taking account of the longer three-year period helps to remind us of this.
Figure 4 | Despite a Tough 2022, the Market is Up 24.79% Over the Last 3 Years

Data from 12/31/2019 – 12/31/2022. Source: Bloomberg, Avantis Investors. Past performance is no guarantee of future results.
A Few Thoughts for 2023
Looking ahead, we will likely face many of the same risks and uncertainties of 2022. For example, it remains to be seen how far the Federal Reserve will go in its campaign to curb inflation, how higher interest rates will affect consumer spending and company earnings, how the war in Ukraine will play out, or what will result from China’s shift away from its zero-COVID policy.
History does offer some perspective, though, for investing in tough times. We can likely expect more volatility in 2023 because it tends to persist and takes time to dissipate. This may test the commitment of investors to remain invested. Still, we shouldn’t forget that the market has already priced in lower expectations, and valuation ratios are more attractive than they were a year prior.
If we consider previous periods when economic uncertainty was high, we’ve seen that the market has historically rallied well before those uncertainties subsided — once light appeared at the end of the tunnel and signs of improving conditions were apparent.
The lesson is that markets react quickly when good news appears and staying in the market is the only way to benefit when it does. Here’s to hoping we see lots of good news in 2023.
Glossary
MSCI ACWI ex-USA Index: A market capitalization-weighted index that is designed to measure the equity market performance of developed and emerging markets, excluding the United States.
S&P 500® Index: A market-capitalization-weighted index of the 500 largest U.S. publicly traded companies. The index is widely regarded as the best gauge of large-cap U.S. equities.
The opinions expressed are those of American Century Investments and are no guarantee of the future performance of any American Century Investments portfolio.
This material has been prepared for educational purposes only and is not intended as a personalized recommendation or fiduciary advice. It is not intended to provide, and should not be relied upon for, investment, accounting, legal or tax advice.
Investment return and principal value of security investments will fluctuate. The value at the time of redemption may be more or less than the original cost. Past performance is no guarantee of future results.
Diversification does not assure a profit nor does it protect against loss of principal.
International investing involves special risks, such as political instability and currency fluctuations. Investing in emerging markets may accentuate these risks.
It is not possible to invest directly in an index.