Put Time on Your Side
It’s unlikely the 1960s Rolling Stones hit “Time Is on My Side” was written with long-term investing in mind. The lyrics suggest it’s a love song, with a confident Mick Jagger exclaiming that sooner or later, his love will realize he indeed is the one for them, and that he’s patient enough to wait.
Patience is a key characteristic in investing as well, especially when deciding to invest in equities. Listening to the song a few times over and inspecting the lyrics in more detail, we can draw some distinct parallels to investing.
Imagine that the song is about someone who is having an internal conflict and hearing competing thoughts about which investment strategy to implement. In this instance, Mick Jagger is our long-term investor.
Why is the long-term equity investor so confident? After all, we know investing comes with risks. One reason for the confidence is the longterm evidence. In Figure 1, we plot the historical annualized returns and volatility for U.S. stocks and one-month Treasury bills (T-bills) from July 1926 through September 2021. U.S. stocks achieved an annualized return of 10.23% over this period, with volatility of 18.45%. T-bills returned 3.27% with volatility of slightly less than 1%.
Figure 1 | U.S. Stocks Have Been the Clear Winners Lately
RETURNS AND VOLATILITY SINCE 1926

Data from 7/1926 - 9/30/2021. Source: Ken French’s data library. U.S. stocks are represented by the CRSP Market Index. Past performance is no guarantee of future results.
In hindsight, it can be easy to look at a table of returns, see a clear winner and think it would have been easy to make the right decision in advance and stick with it. But we are talking about a period of almost a century, a tremendous amount of time.
Having the patience Mick Jagger sings about would have been critical for someone to have achieved these returns. Why? The difference in returns between stocks and T-bills is known as the equity risk premium, and it exists because investors take on some uncertainty in their outcomes.
The price investors pay is discounted enough so the future expected return is higher than the risk-free rate. There are forward-looking expectations built into the discount rates investors assign when pricing stocks, and new information can cause investors to adjust their expectations, which inevitably impacts prices. Prices can unexpectedly go down or up.
When Does Risk Appear?
There is no way to know when the “risk” side of the risk premium will show up. If we look back in history, we can find some short (and not so short) periods when T-bills beat stocks. These periods can serve as examples of what may happen again in the future, but a confluence of factors can impact the market environment at a given point in time. That’s part of the reason why volatility, or uncertainty, is a foundational characteristic of investing.
While we can’t precisely know when the bad piece of the uncertainty will show up, we can take the almost 100 years of data from Figure 1 and start to break the returns into shorter periods that may be easier to grasp and inform our expectations.
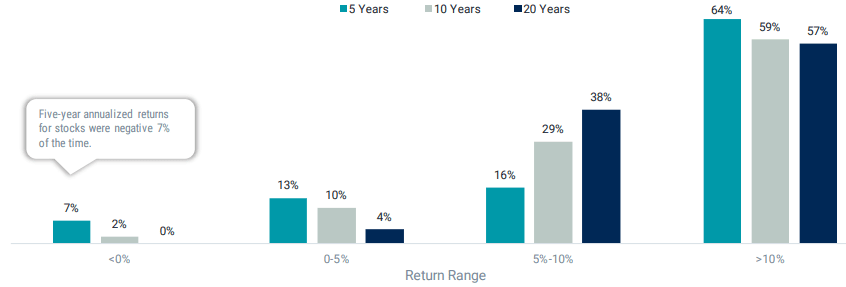
In Figure 2, we plot four return ranges and show the frequency of U.S. stocks achieving these returns over five-, 10- and 20-year periods. For example, in the July 1926 to September 2021 data, five-year annualized returns for stocks were negative 7% of the time. In contrast, 10-yearannualized returns were negative only 2% of the time, and no 20-year annualized returns were negative.
Figure 2 | How Often Have Certain Returns Occurred Historically
DISTRIBUTION OF U.S. STOCK RETURNS OVER FIVE-, 10- AND 20-YEAR PERIODS SINCE 1926

Data from 7/1926 - 9/2021. Source: Ken French data library, Avantis Investors. U.S. stocks are represented by the CRSP Total Stock Market Index. Past performance is no guarantee of future results.
Recall from Figure 1 that the long-term annualized return over the full data set is a little higher than 10%, so it’s unlikely a majority of 10- or 20-year averages would fall below that number. But there are really two relevant takeaways here. First, you can absolutely have extended periods where equity returns are negative. Second, the longer an investor was willing to stick with their investment in equities historically, the more likely they were to have been rewarded with a positive outcome. The relationship between risk/volatility and return is quite clear.
Tilting the Odds in Your Favor
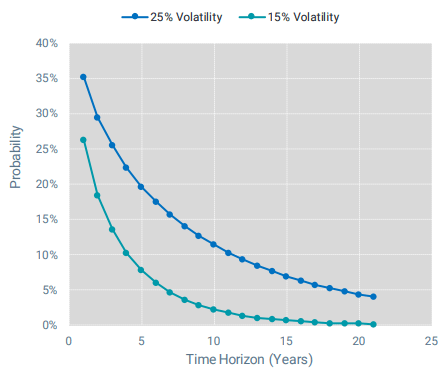
We can look at the relationship between returns and volatility through a slightly different lens, thinking more about the distribution of potential outcomes. Based on an assumed level of return and volatility, we can create a probability distribution to look at the odds of having a negative return—or losing money from the initial investment—over various time horizons. This is illustrated in Figure 3 where we plot two potential investments with the same assumed annual rates of return, 10%, with different levels of assumed volatility, 15% and 25%, respectively.
What do we find? In both cases, the probability of having a negative outcome decreases as we extend the time horizon, which should be expected. But the shape of the line for the 25% volatility investment is slightly different than the 15% volatility investment. It doesn’t decrease as quickly and is markedly higher at 10 years (11.4% chance of a negative outcome vs. 2.2% for the 15% volatility investment) and 20 years (4.4% vs. 0.2%, respectively).
Figure 3 | Probability of Losing Money Over Different Time Horizons

Source: Avantis Investors. The chart shows a probability percentage (from 0-100%) of a negative return for two investments, both with an assumed 10% annual rate of return but with different levels of assumed volatility (15% and 25%, respectively).
This illustration gives us a glimpse into the role diversification can play in investing and why trade-offs in asset allocation and portfolio construction can be so important to long-term expected outcomes. All else equal, if we can control for the level of diversification, we believe we can reduce the probability of bad outcomes.
This explains why it may be wise to avoid being too concentrated in a single stock or sector. We can also run similar analysis to show that if we can find investments with more attractive expected returns without affecting volatility, that too can reduce the probability of bad outcomes. In both cases, there are important trade-offs to consider, and financial advisors can be helpful in discussing those trade-offs and how they may impact the asset allocation and expected long-term outcomes.
Combat Short-Term Noise With a Tune of Your Own
The illustrations from these simple experiments also convey the noisiness of short-term outcomes in investing. Even over a five-year period, an investment with an assumed 10% annual rate of return and 15% volatility has a better than 1 in 10 chance of having a negative outcome. Five years may seem like a long time to a lot of people.
After a short run of poor returns, or some increased volatility, people can be tempted to abandon their long-term asset allocations. These issues are only magnified today with the power of technology and the ability to get constant updates on returns, portfolio values and news about the next “big risk” or “sure thing.”
When this inevitably happens, maybe we should try to drown out the noise by channeling our own inner Mick Jagger and remembering that time is on our side.
Glossary
CRSP Total Stock Market Index. Comprised of nearly 4,000 constituents across mega, large, small and micro capitalizations, representing nearly 100% of the U.S. investable equity market.
Expected Return. The amount of profit or loss an investor can anticipate receiving on an investment.
Standard deviation. A statistical measurement of variations from the average. In finance, it's often used to measure volatility and risk. In general, a higher standard deviation means more volatility and more risk.
This material has been prepared for educational purposes only. It is not intended to provide, and should not be relied upon for, investment, accounting, legal or tax advice.
Investment return and principal value of security investments will fluctuate. The value at the time of redemption may be more or less than the original cost. Past performance is no guarantee of future results.
Diversification does not assure a profit nor does it protect against loss of principal.
It is not possible to invest directly in an index.