2024 Market Forecasters’ Report Card
Have you ever written down, at the start of a year, predictions for what will happen in the year ahead? For investors, taking note of your beliefs about the market or economy and then coming back later to inspect can be a good exercise in understanding the difficulties of forecasting.
It’s a lesson we can even observe from the public track records of industry economists. Around this time each year, many banks and asset managers put out their predictions for where the price of the S&P 500® Index will land by the end of the following year. These estimates are widely publicized, making it easy to go back to see how close or far past predictions were from realized results. As anticipated price targets for the end of 2025 begin to circulate, looking at how last year’s forecasts have fared may be helpful.
Wide Range of 2024 S&P 500 Predictions
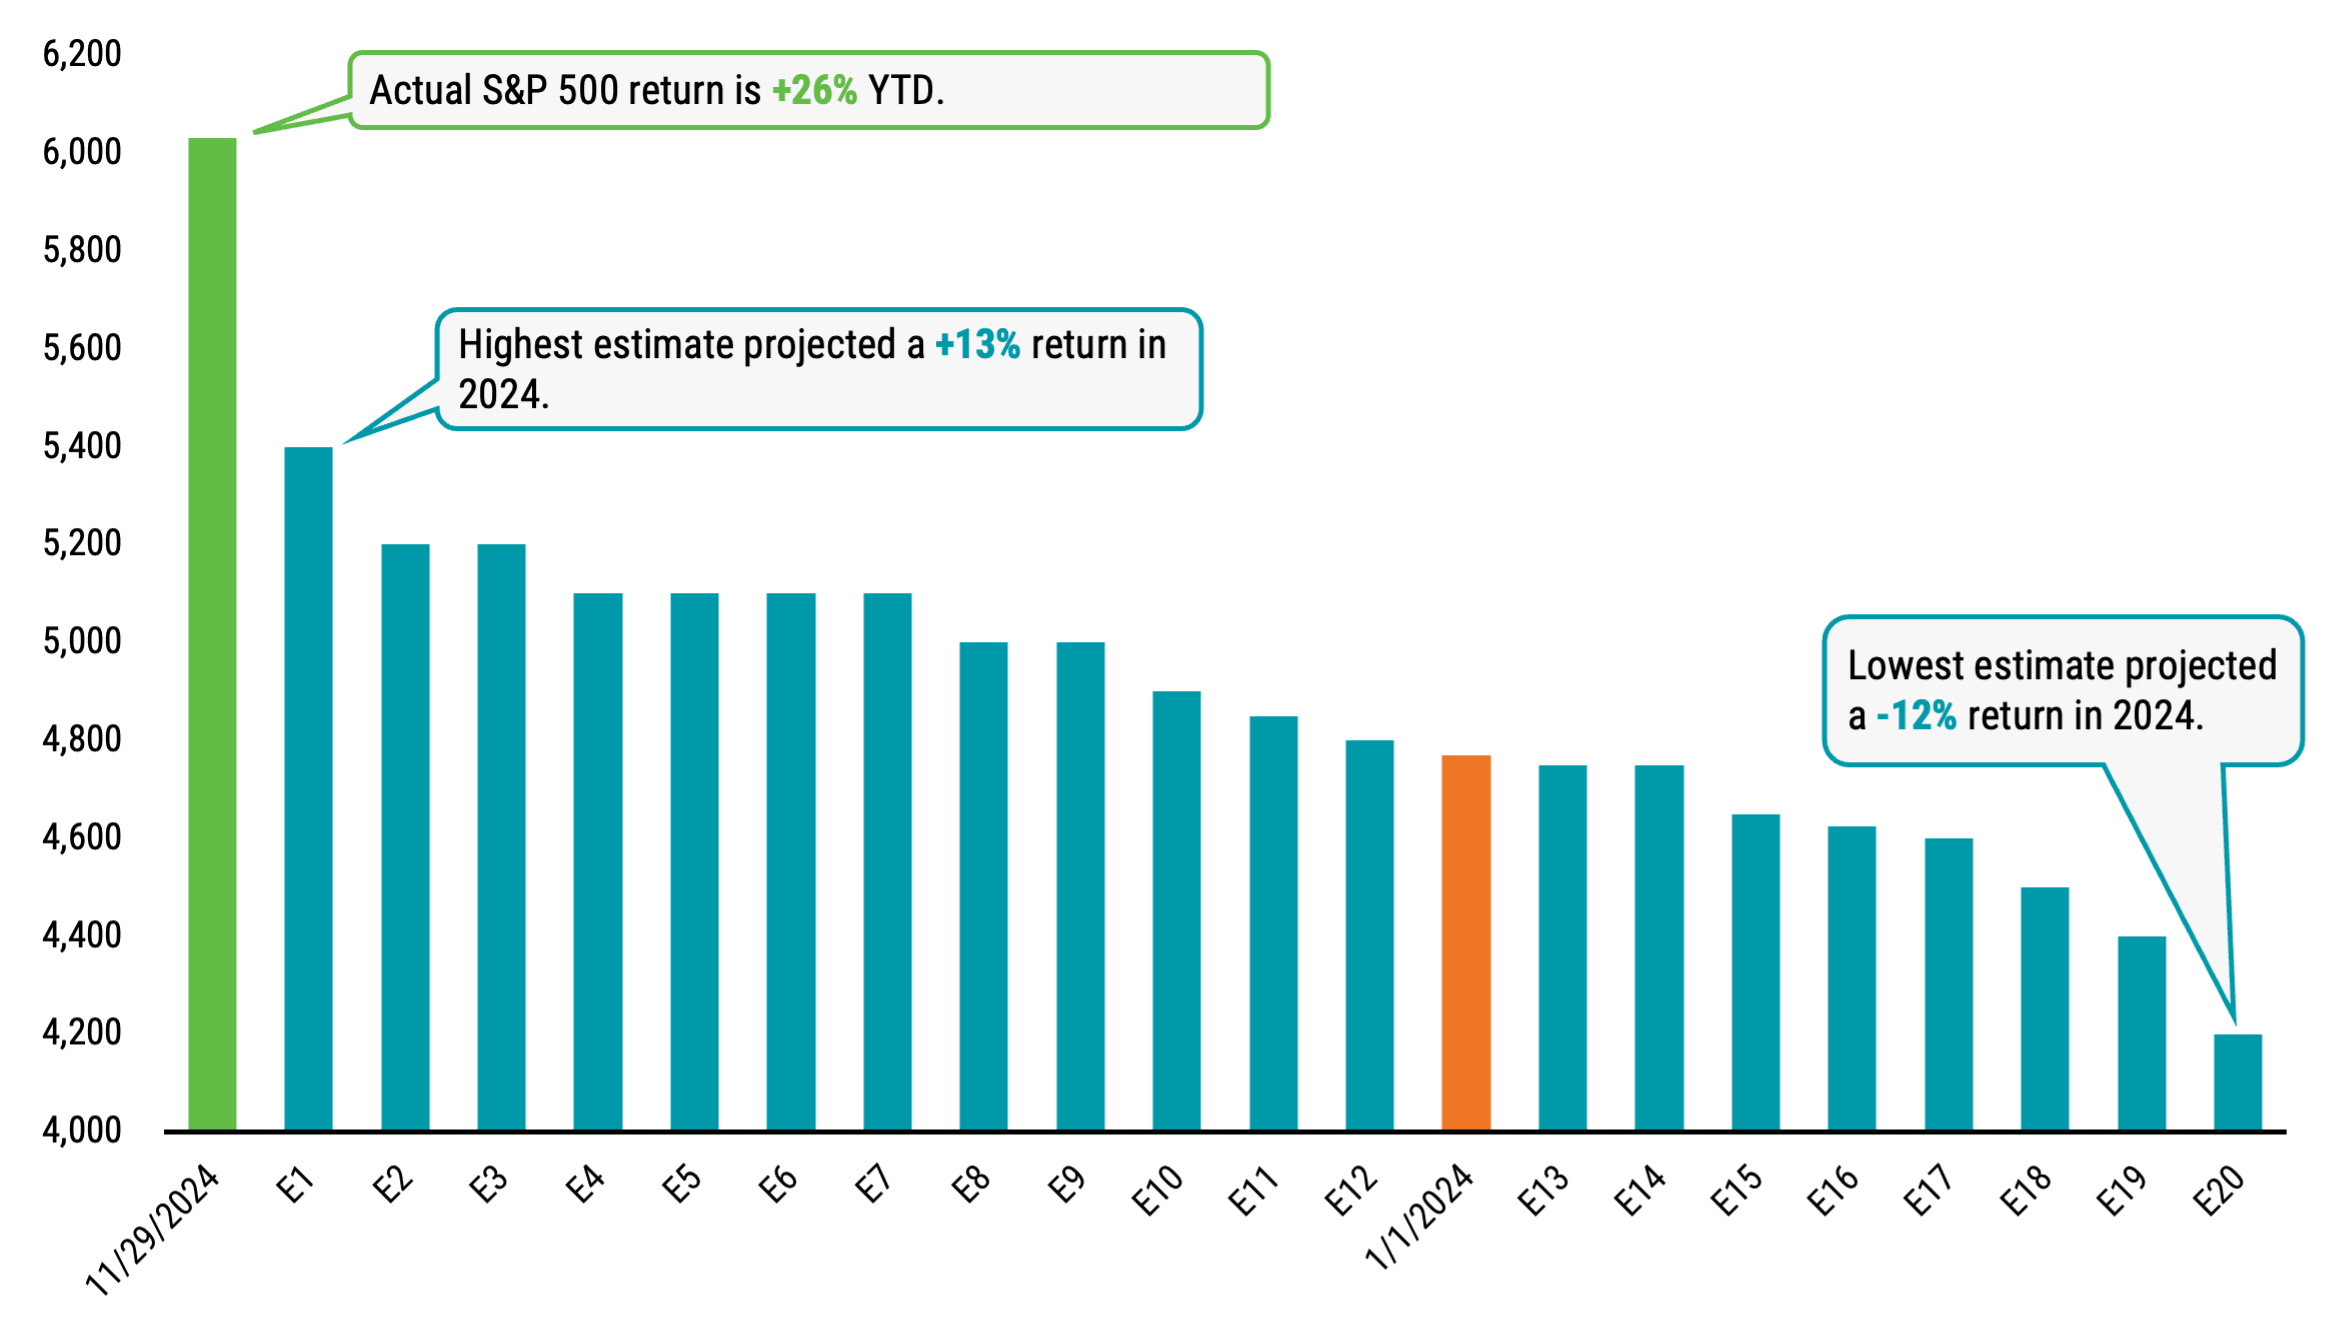
In Figure 1, we’ve aggregated year-end 2024 price targets for the S&P 500 from 20 firms, all issued in late 2023. There are several striking takeaways. First, there’s a wide range of views across firms. The highest estimate (E1) predicted the S&P to close 2024 at 5,400 — a projected rise of more than 13% versus the S&P’s 2023 closing price of 4,770. The lowest estimate (E20), at 4,200, projected the S&P to decline by about 12%.
Figure 1 | 2024 Forecasts Missed the Mark
Year-End 2024 S&P 500 Price Targets From the End of 2023

Data as of 11/29/2023. Source: Tom Aspray, “Should You Worry That Strategists Keep Raising Their S&P 500 Targets?” Forbes, October 20, 2024.
Moreover, none of the 20 estimated year-end price targets are even close to where the S&P now stands a month away from the end of the year. With the S&P’s 26% rise year to date in 2024, the index level stood above 6,000 at the end of November. This makes the annual return implied by the closest estimate (E1) currently more than 10 percentage points too low (26% vs. 13%) and the furthest estimate (E20) nearly 40 percentage points too low (26% vs. -12%)!
Another way to assess the results is to consider the median estimate. Given that it's the mid-point view, this is sometimes called the “consensus.” There’s some logic to the relevance of this data point. If individuals aren’t very good at predicting the market's future path, perhaps their collective wisdom performs better.
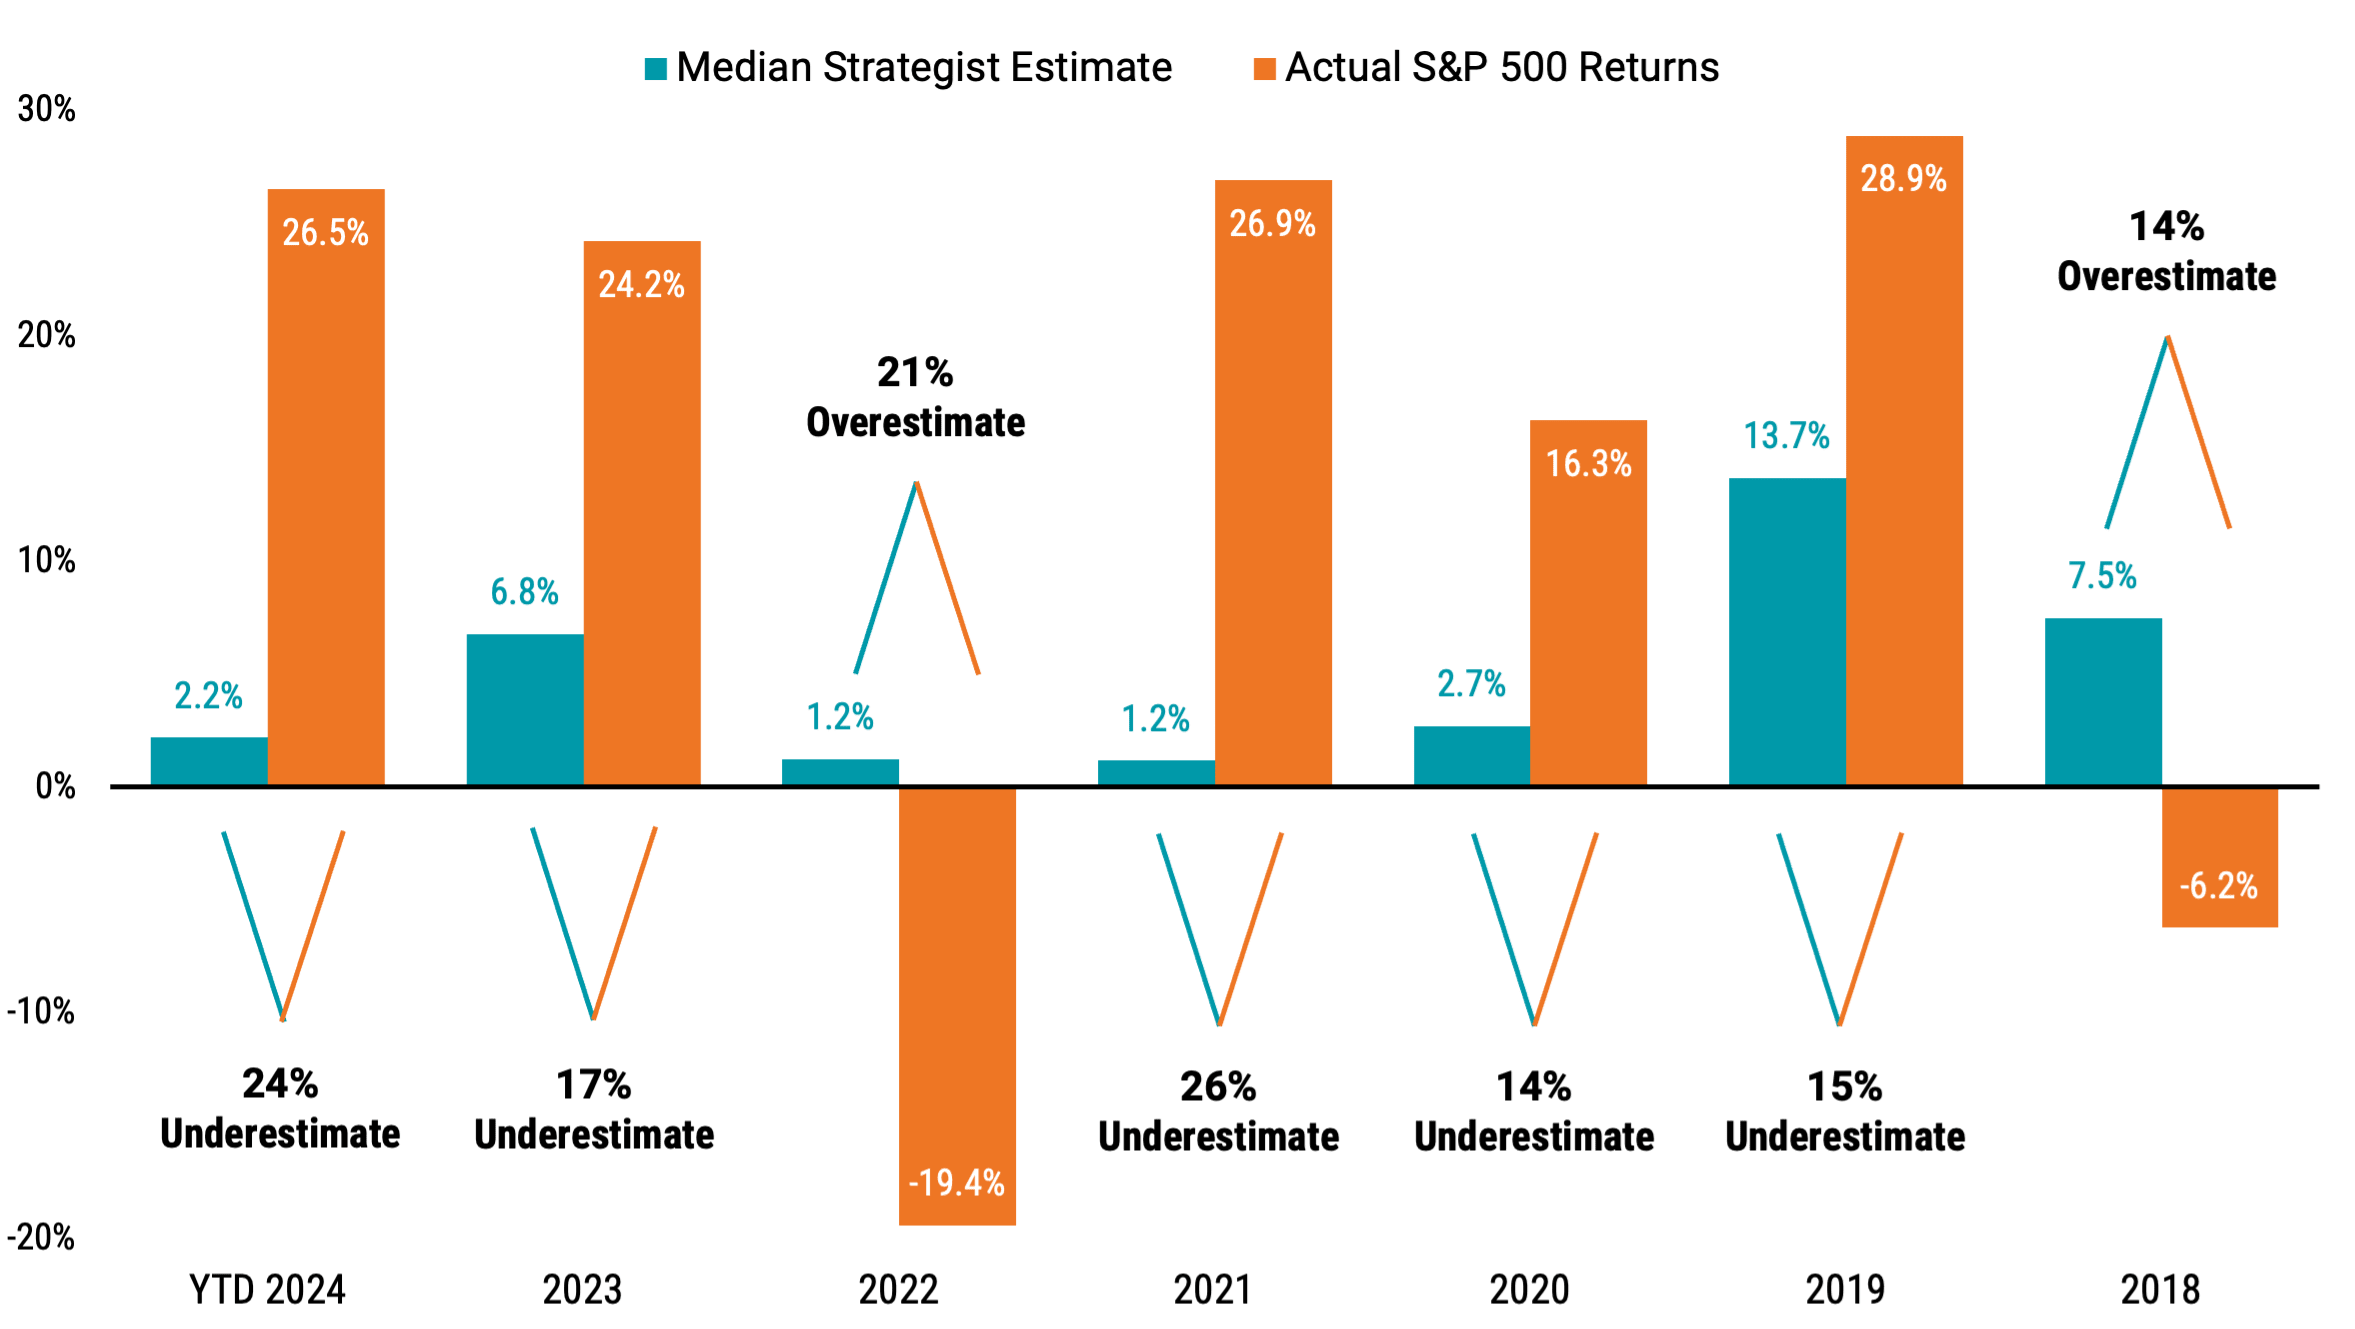
Given that none of the 20 firms in the 2024 sample were in the ballpark of the actual results we’ve observed, it’s no surprise that the median estimate is also well off the mark. However, we can extend this analysis to see how the consensus estimates have stacked up against actual market performance in past years.
Evaluating Forecast Accuracy Over Time
In Figure 2, we show the implied return based on the consensus S&P 500 year-end price targets versus the actual return of the S&P in those years from 2018 through 2024. Remarkably, the consensus estimates have consistently underwhelmed. Over the seven years in our study, the implied return from the consensus estimates was never within 10% of the actual S&P 500 return. It ranged from an underestimate of 26% to an overestimate of 21%.
Figure 2 | Consensus S&P 500 Estimates vs. Actual Returns (2018-2024)

Data from 1/1/2018 - 11/30/2024. Sources: Emily McCormick, “What Wall Street Strategists Forecast for the S&P 500 in 2019,” Yahoo Finance, December 31, 2018; Jeff Sommer, “Clueless About 2020, Wall Street Forecasters Are at It Again for 2021,” New York Times, December 18, 2020; Jeff Sommer, “Forget Stock Predictions for Next Year. Focus on the Next Decade,” New York Times, December 16, 2022; Senad Karaahmetovic, “Top Wall Street Strategists Give Their S&P 500 Forecasts for 2023,” Investing.com, December 27, 2022; and Tom Aspray, “Should You Worry That Strategists Keep Raising Their S&P 500 Targets?” Forbes, October 20, 2024. Past performance is no guarantee of future results.
The evidence for why investors should exercise caution when attempting to forecast short-term market movements or relying on estimates they see in the media is very strong. Even worse is trying to time markets based on these predictions. Imagine missing out on the U.S. market returns so far in 2024 after being spooked out of the market by the pessimistic forecasts from several different strategist firms in late 2023.
The Importance of Staying Invested
However, you may remain curious about what “the Street” has to say about its expectations for 2025.1 Among those that have issued year-end 2025 price targets for the S&P 500, the outlook appears rosier than what we’ve tended to hear in the past handful of years. Price targets from eight firms for 2025 range from 6,500 to 7,000, with a median of 6,633. The median price level implies about a 10% return from where the index stands today.
Still, investors face uncertainties. Many are grappling with how a new administration with several high-impact policy proposals will affect markets and the economy. Some are finding reasons for optimism, while others harbor reasons for pessimism.
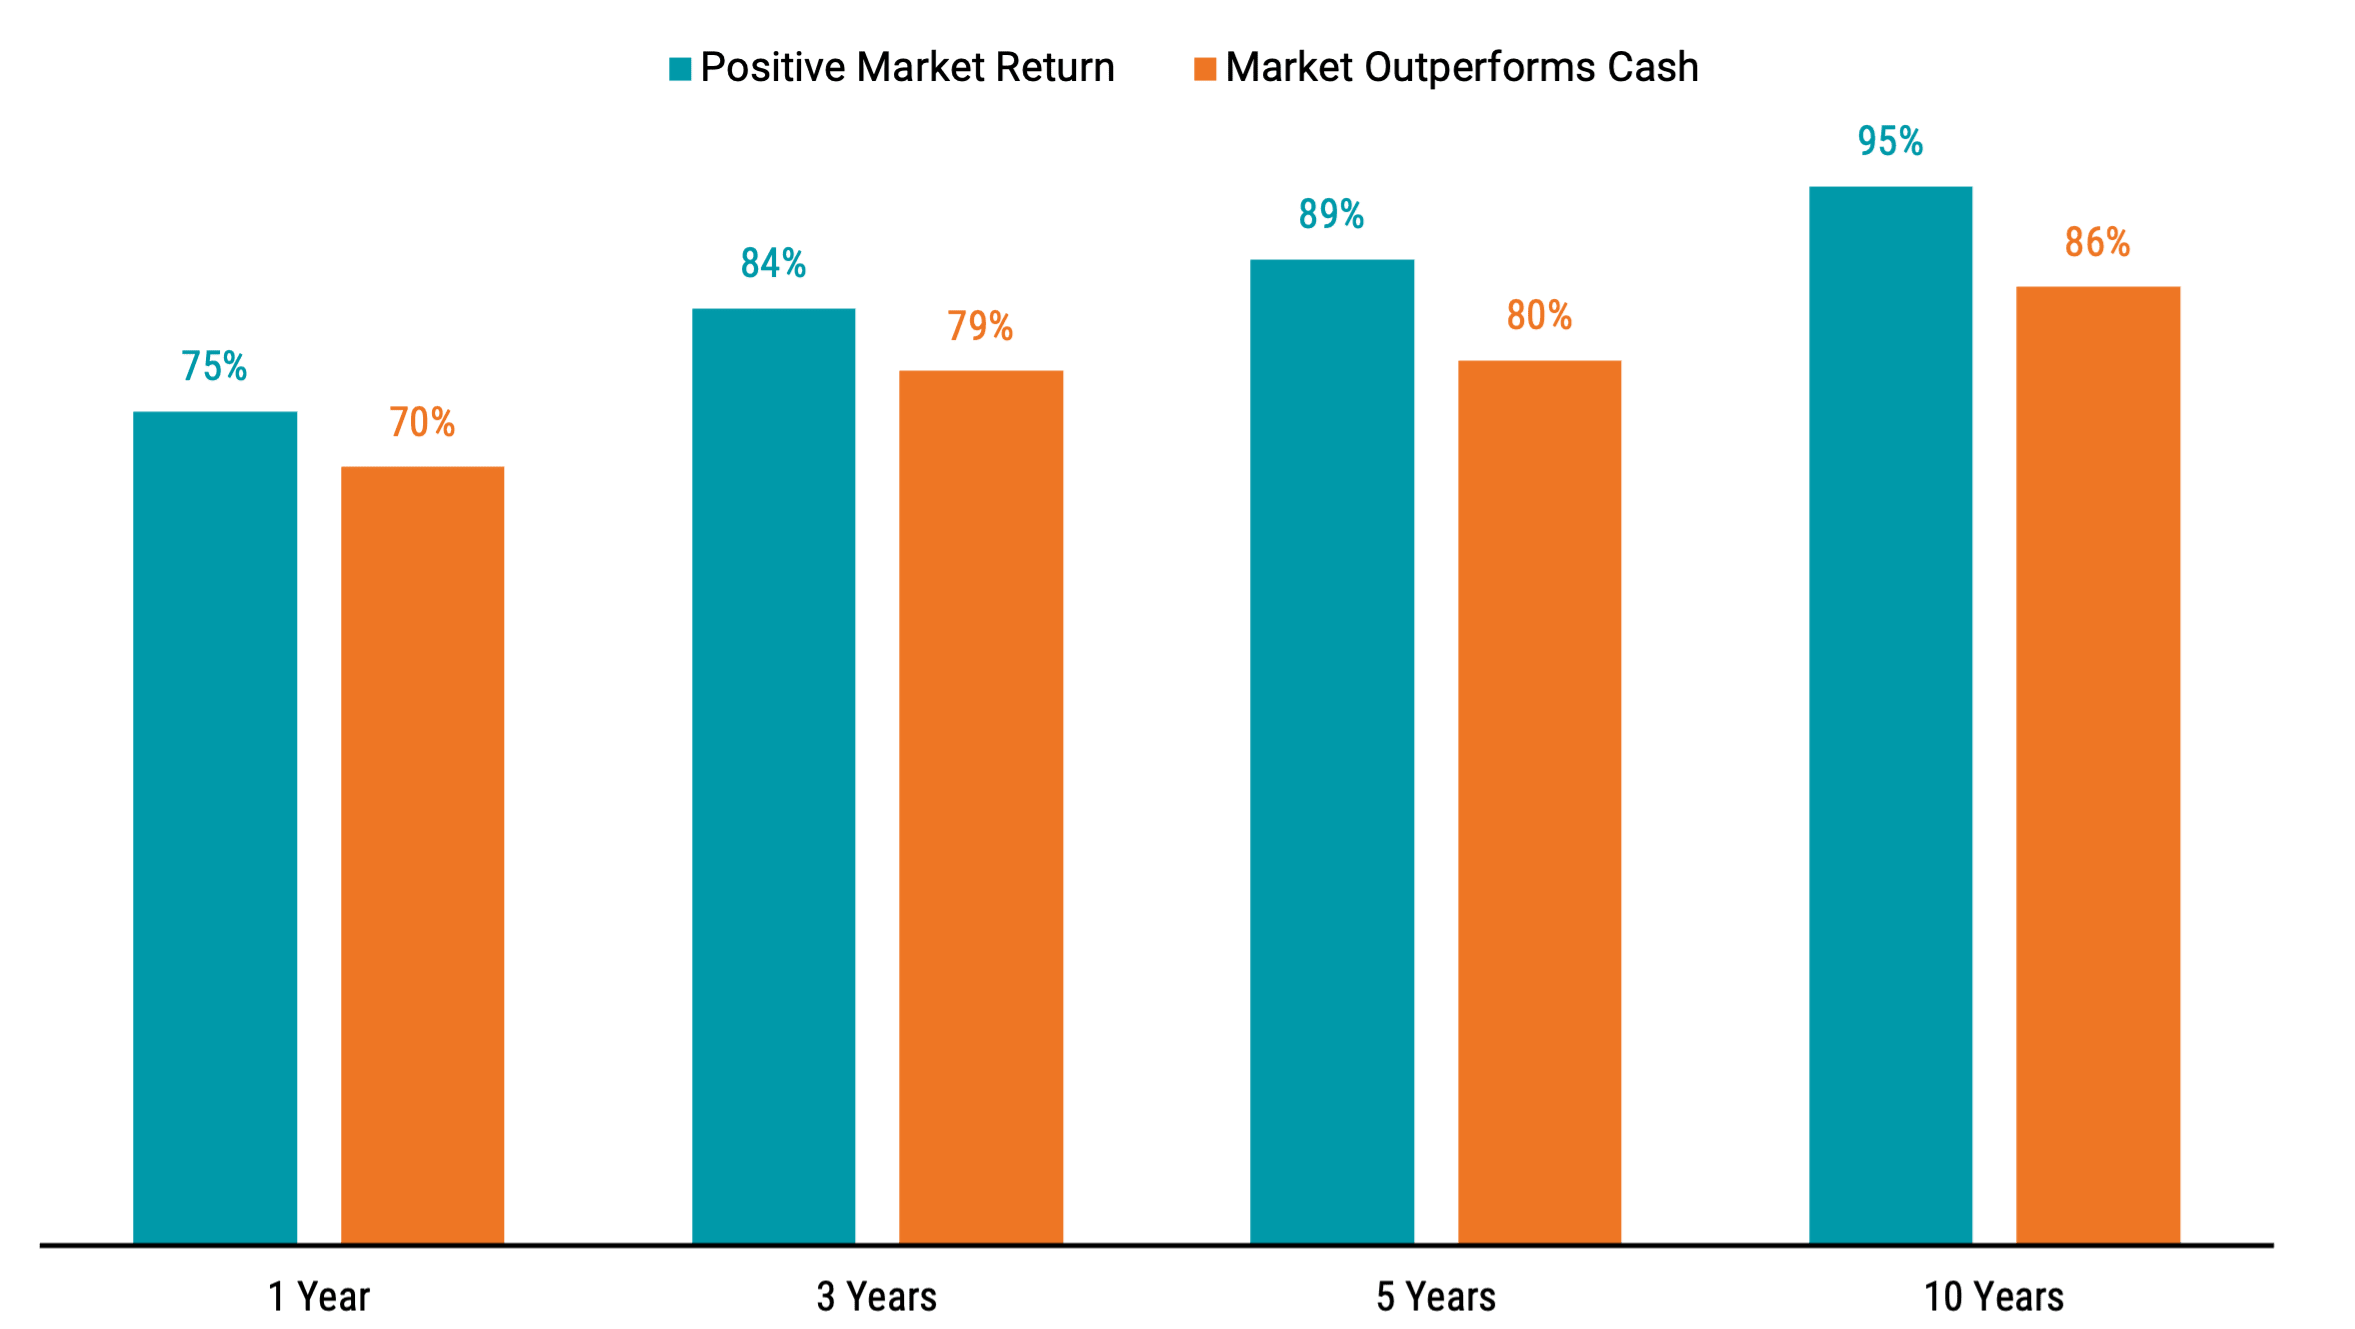
But regardless of where you land on the spectrum from optimistic to pessimistic on the market, what’s clear is that reality doesn’t have to, and often won’t, match those expectations. For example, it’s not uncommon for investors to take a period of strong market performance as a sign that the market is due for a “correction,” but as shown in Figure 3, the market tends to deliver positive returns in excess of cash over time. Stock prices are set so expected returns are positive above the risk-free rate, regardless of whether markets have performed well or poorly of late.
Figure 3 | Time Puts the Odds in Your Favor
Based on Monthly Rolling Returns from January 1927 – September 2024

Data based on monthly U.S. stock and cash returns from January 1927-September 2024. U.S. stocks are represented by the Market Portfolio and cash from the RF (risk-free) Portfolio from Ken French’s data library. Monthly rolling return analysis includes 1,162 1-year periods, 1,138 3-year periods, 1,114 5-year periods, and 1,054 10-year periods. Return periods greater than one year are annualized. Past performance is no guarantee of future results.
The good news is that investors don’t have to accurately predict markets in the short term to have a good long-term investment experience. Remaining disciplined over time in an asset allocation suited to your goals and risk tolerances historically has a strong track record of success.
Glossary
S&P 500® Index: A market-capitalization-weighted index of the 500 largest U.S. publicly traded companies. The index is widely regarded as the best gauge of large-cap U.S. equities.
Diversification does not assure a profit nor does it protect against loss of principal.
Investment return and principal value of security investments will fluctuate. The value at the time of redemption may be more or less than the original cost. Past performance is no guarantee of future results.
This material has been prepared for educational purposes only. It is not intended to provide, and should not be relied upon for, investment, accounting, legal or tax advice.
The opinions expressed are those of the investment portfolio team and are no guarantee of the future performance of any Avantis Investors portfolio.