Not So Fast! Lessons From a Short-Term Panic Event
Key Takeaways
Japanese stocks experienced a historic single-day decline in early August. However, the market rebounded rather quickly.
The decline was followed by a spike in global market volatility, with the CBOE Volatility Index (VIX) reaching levels seen only during major financial crises.
Historically, as with this example, keeping focus on the long-term and staying invested during short-term panic events is likely to lead to better outcomes for investors versus selling and trying to reenter later.
On August 5, Japanese stocks, as measured by the TOPIX 500 Index, declined by an eye-popping 12.3% in local currency (yen – JPY). It was the largest single-day decline for the Japanese market since Black Monday in October 1987. A rapidly strengthening yen versus the U.S. dollar (USD) likely eased the drawdown for most U.S.-based investors, but the loss was still close to 10% in dollar terms.
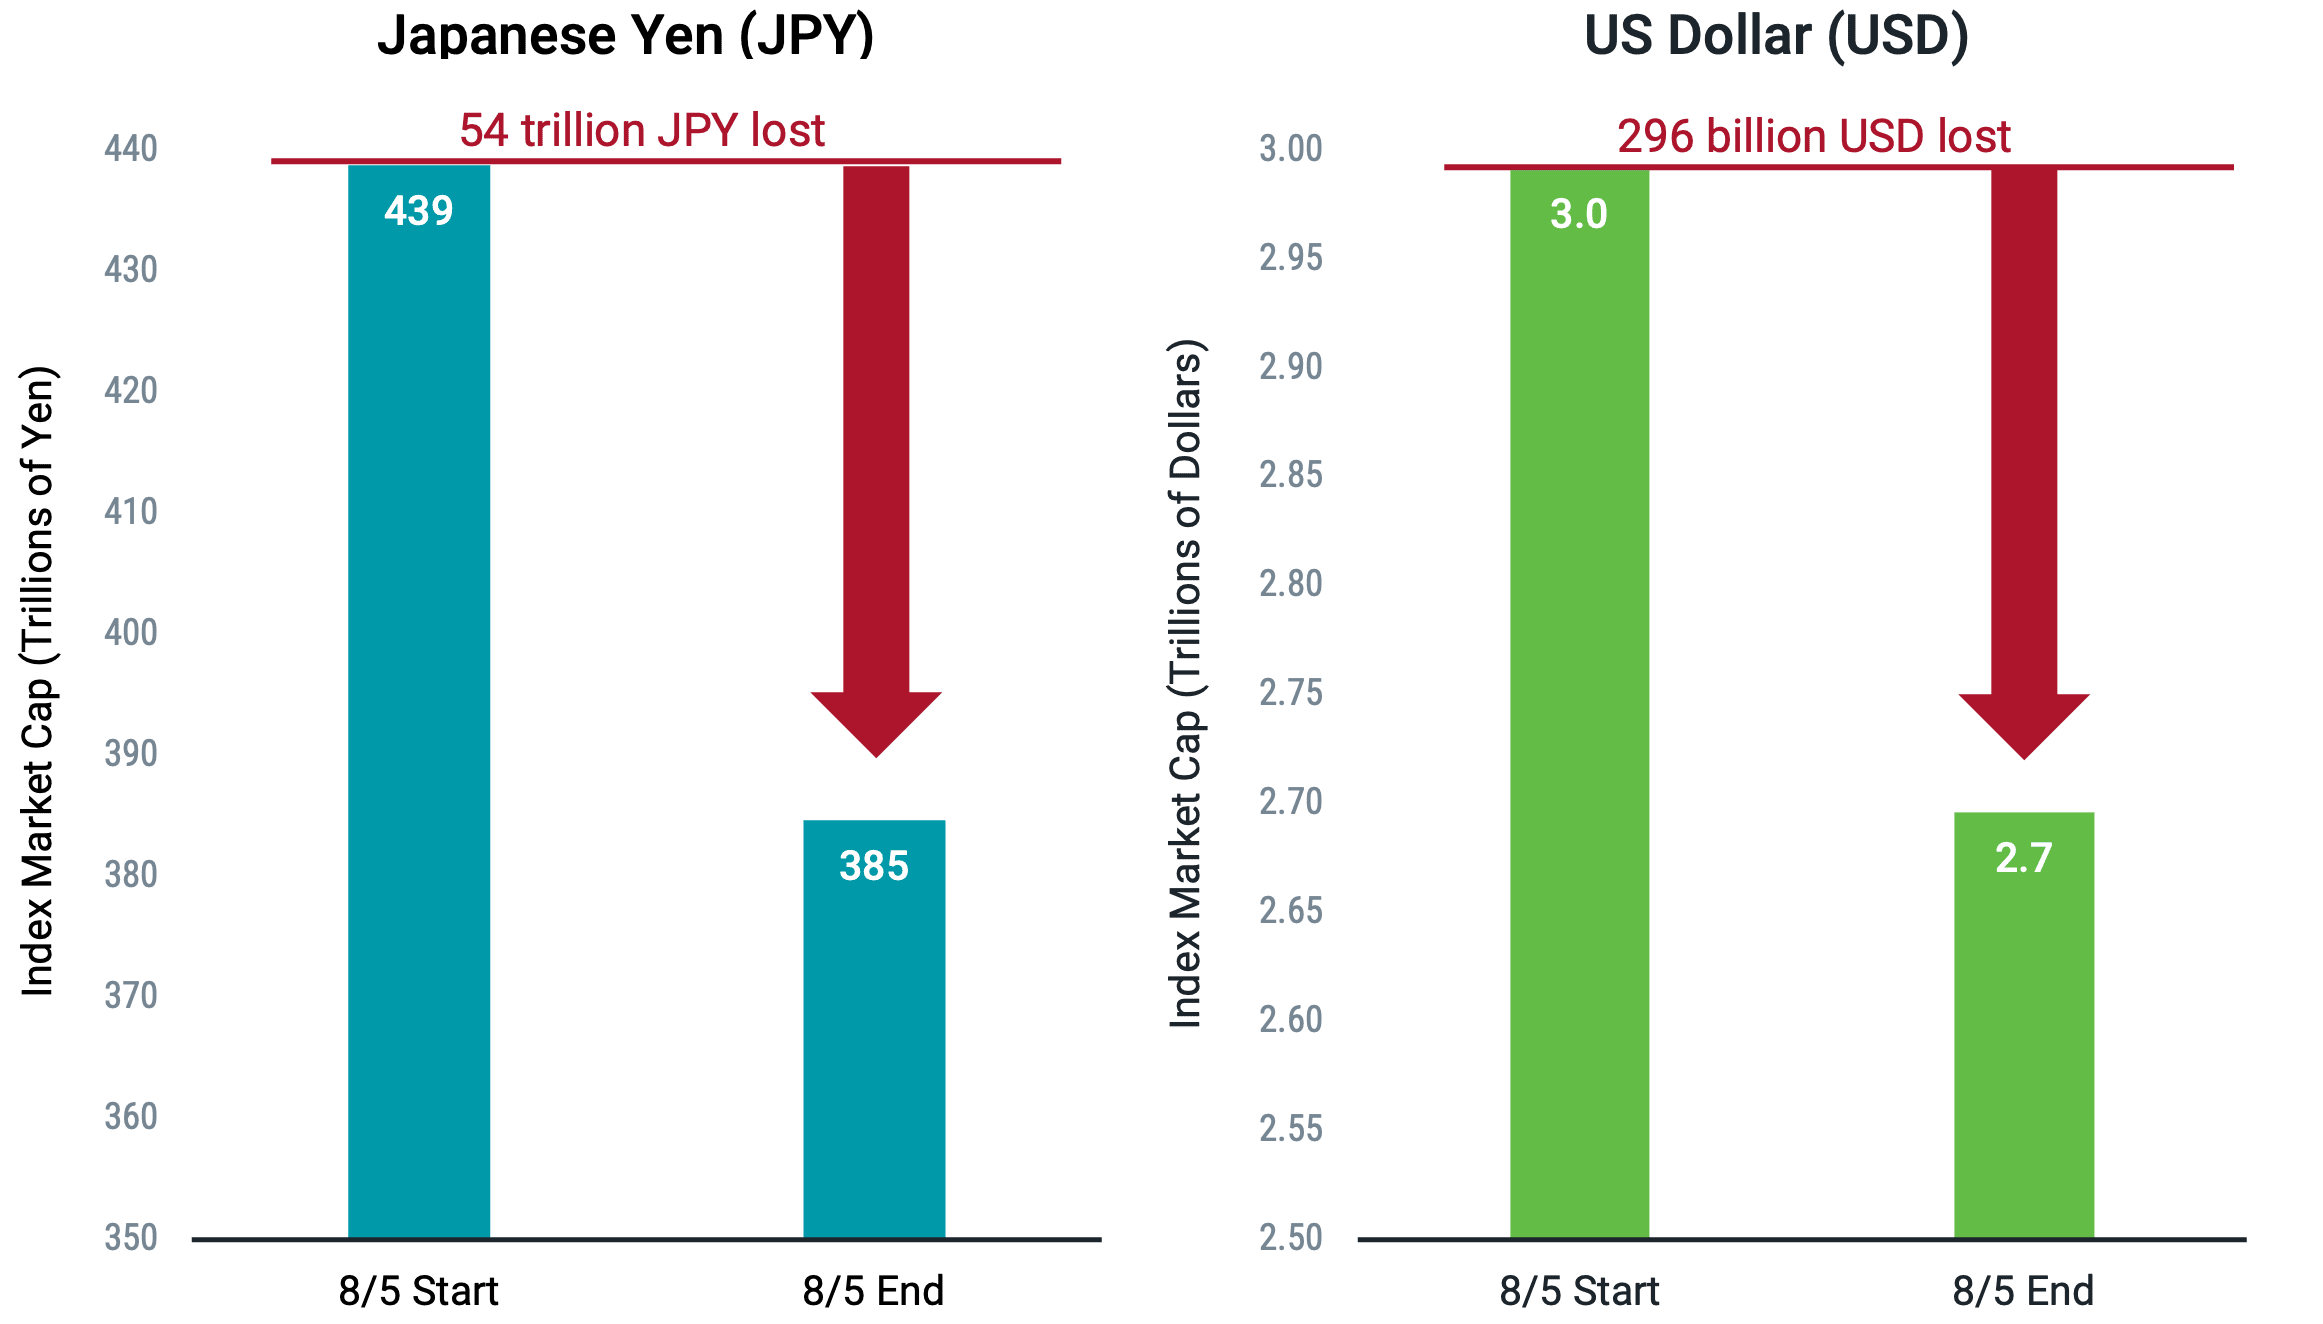
Considering this decline in total value lost helps to put into context the extreme magnitude of the impact on investors. Figure 1 presents the total market capitalization of companies in the TOPIX 500 at the start and end of August 5 in terms of JPY and USD. A remarkable 54 trillion of market capitalization was lost in JPY and 296 billion in USD on this single day.
Figure 1 | Massive Value Was Lost in the Japanese Market
Market Capitalization of the TOPIX 500 Index at the Start and End of August 5 (JPY, USD)

Data from 8/5/2024, based on the TOPIX 500 Index in JPY and USD. Source: Bloomberg.
Global Ripple Effects and Volatility
Fear quickly spread worldwide, with most major global markets posting losses. Many news outlets painted a bleak picture. Headlines commonly labeled the event in terms like “crash” and “global market meltdown.” Some speculated that the worst was still to come.
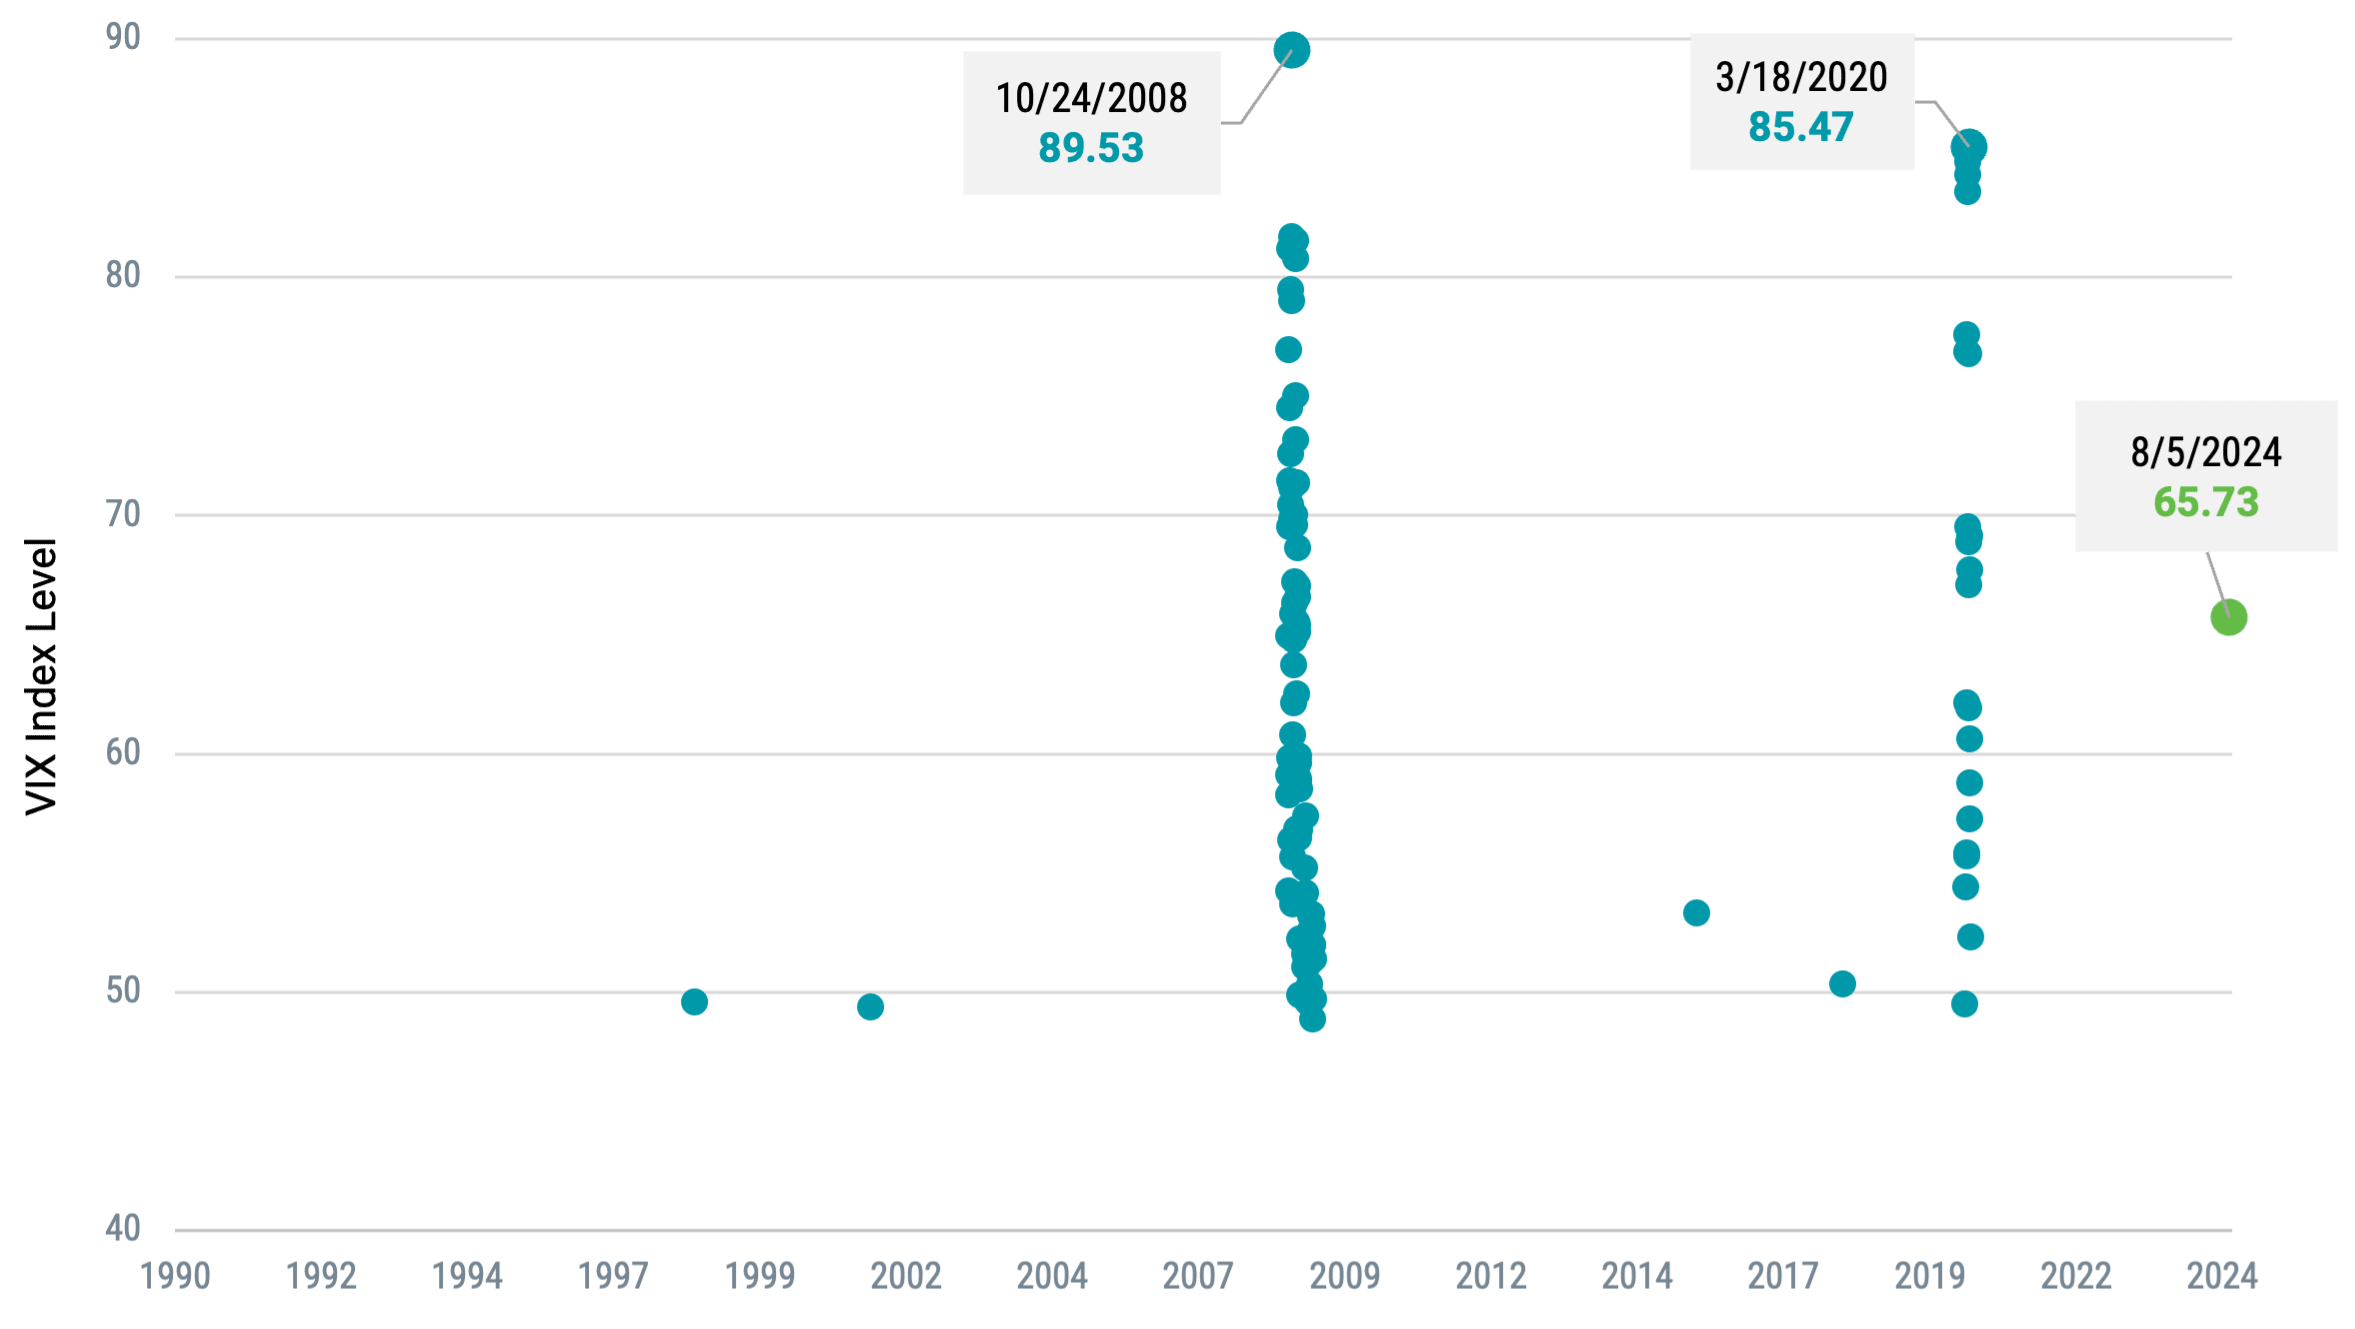
In the U.S., the rise in volatility was apparent in elevated VIX Index readings, which jumped from around 20 at the end of the prior week to more than 65 on August 5. As shown in Figure 2, which plots the 100 highest intra-day VIX levels since the VIX was incepted in 1990, the high on August 5 marked the only time on record that the VIX exceeded 60 outside of 2008 during the Great Financial Crisis and in 2020 following the rise of the COVID-19 pandemic.
Figure 2 | The August VIX Spike Reached Levels Never Seen Outside of 2008 and 2020
100 Highest Intra-Day VIX Levels Since 1990

Data from 1/1/1990 - 8/30/2024. Source: CBOE.
The next day, the Japanese market began to bounce back, returning 9.4% in JPY. By the following week, it had regained all ground lost the day the market crashed. In the U.S., the VIX quickly eased after the spike on the 5th, settling in the 20s later that week. After August 12, it didn’t close above 20 through the end of the month.
What Caused the Market Decline?
Many have hypothesized, pointing to things like the rate hike from the Bank of Japan in late July, the strengthening of the yen that followed, softer economic reports in the U.S. and China, rising expectations for near-term rate cuts from the Federal Reserve, and, of course, the oft-reported unwinding of the yen carry trade.1 While theories may provide for interesting reading, the truth is that it’s unclear to what extent any one of these or other factors drove the sharp decline in the Japanese market or the broader spread of volatility globally.
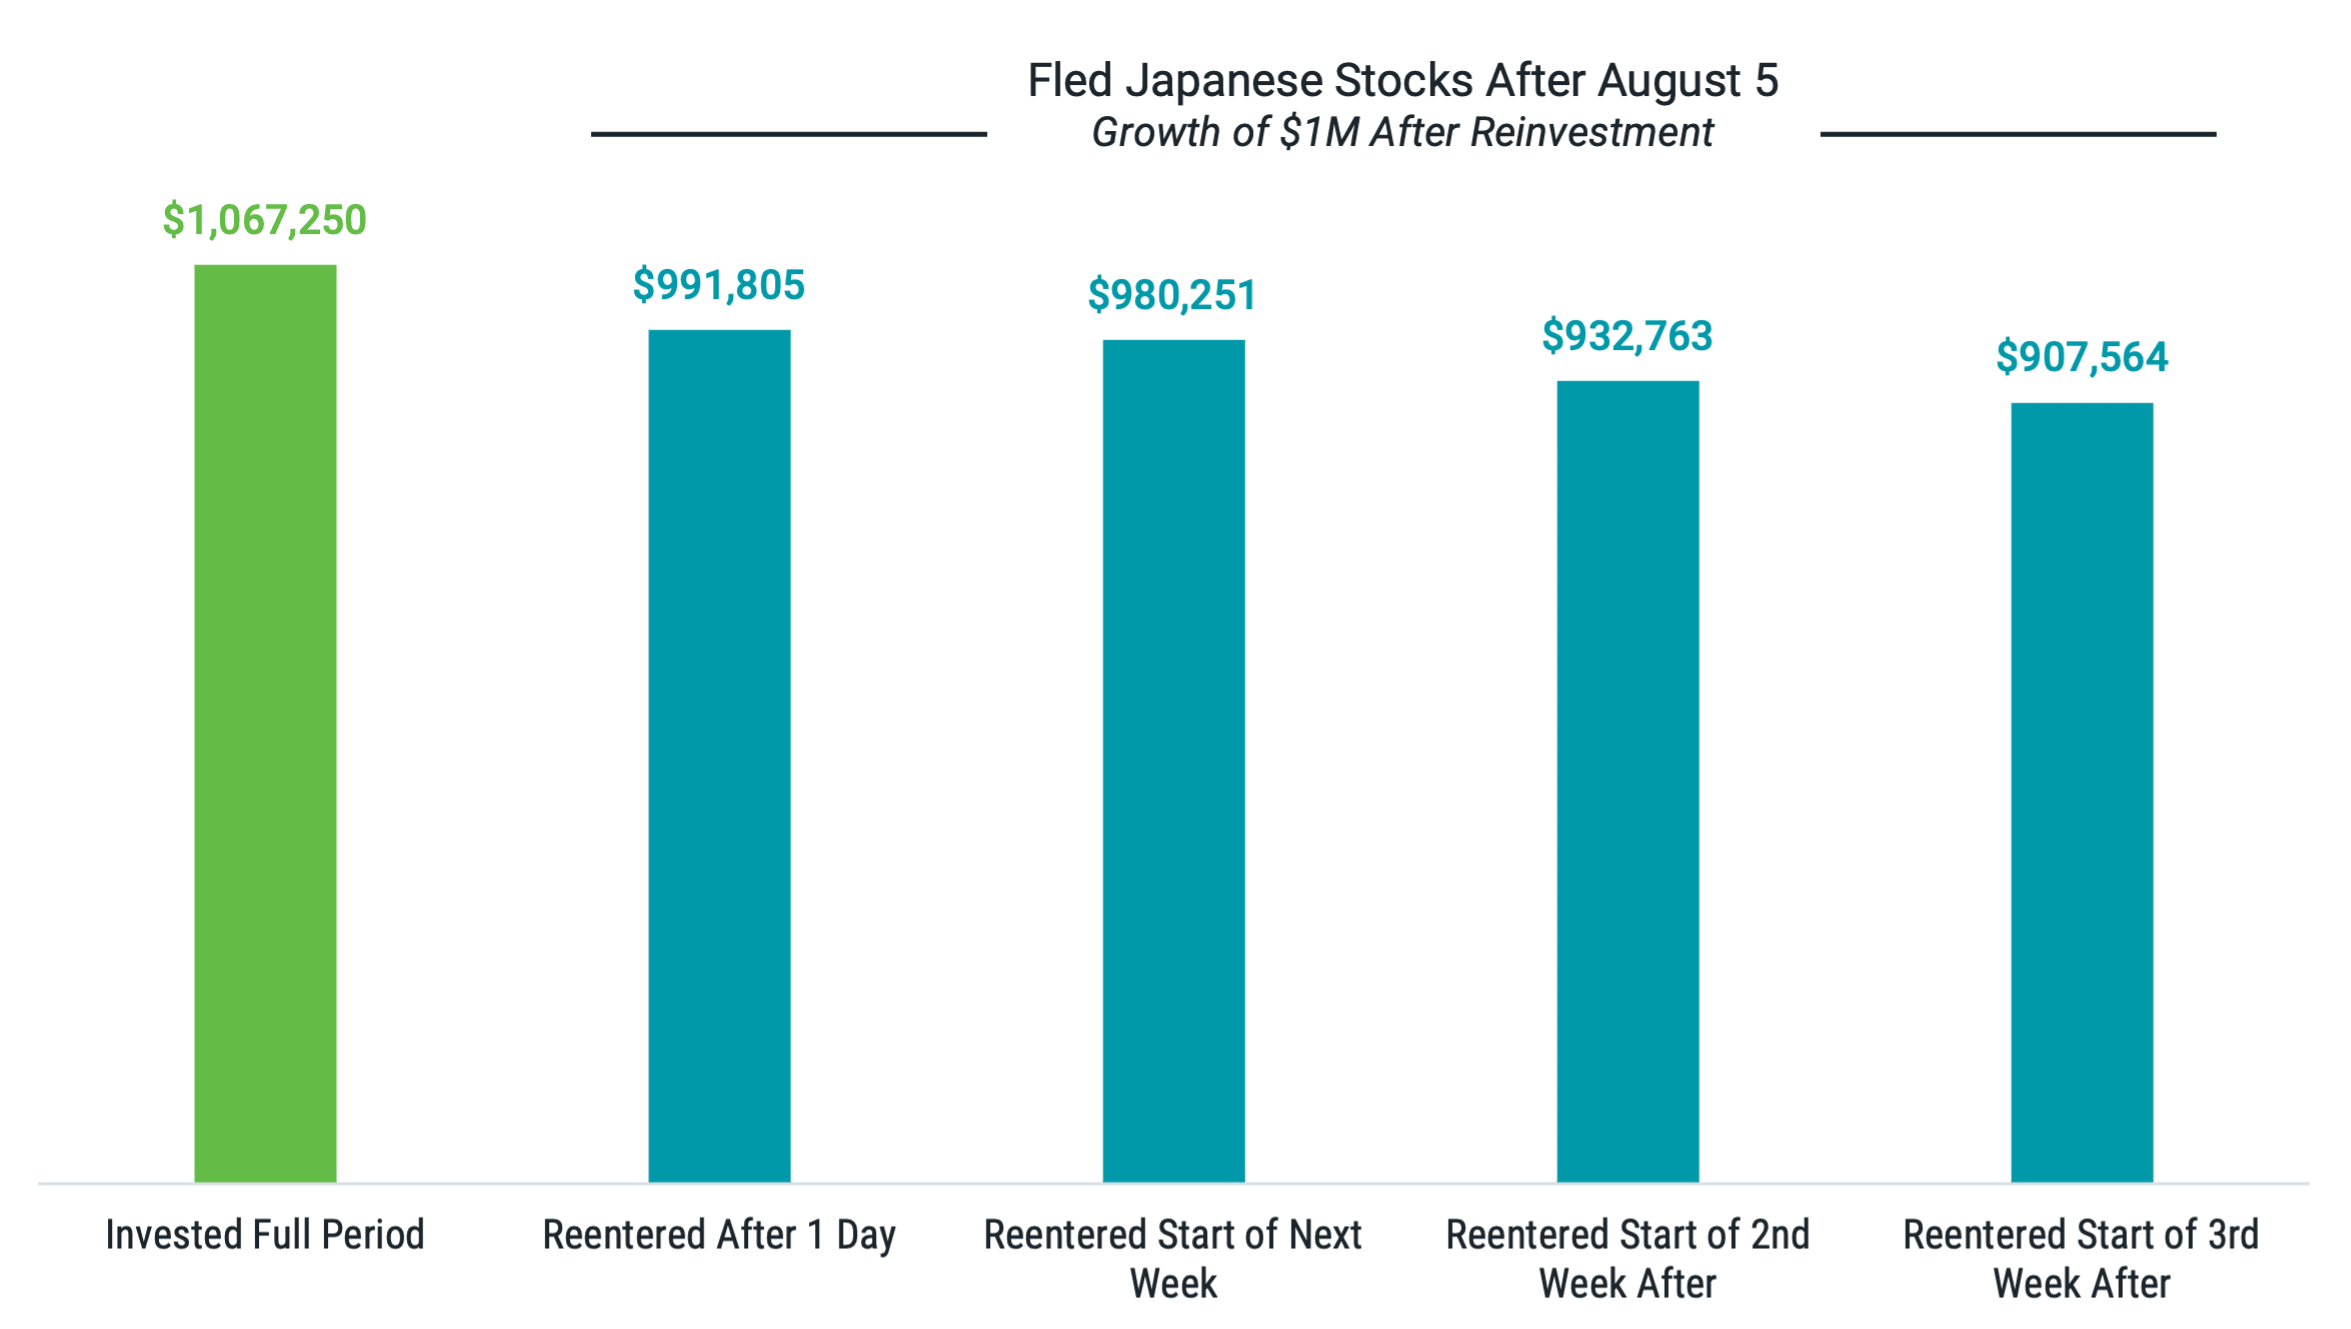
What is clear is that investors who allowed this bout of anxiety to drive them out of the market are unlikely to have fared better than those who stood pat. Figure 3 presents estimates of outcomes for investors who owned $1 million in Japanese stocks at the start of August 5, sold their position after the close on August 5 and then reinvested at varying points after that, holding through the end of August.
Figure 3 | Selling Japanese Stocks After August 5 Likely Meant Missing the Recovery

Data from 8/5/2024 - 8/30/2024, based on the TOPIX 500 Index (total return, USD). Source: Bloomberg. Past performance is no guarantee of future results.
For example, “Reentered After 1 Day” means divesting only the day after the crash, while “Reentered Start of the Next Week” means being out of the market for the remainder of the week after the crash. The outcomes also assume investors earned no return on their cash when not invested in stocks.
While that may not be the reality for an investor, the point is simply to highlight potential differences between remaining in and exiting the market and the additional challenge of attempting to figure out the “right” time to reenter the market after flying to safety.
The results show that, incredibly, holding the initial investment through the full period added nearly $70,000 to the initial $1 million position despite losing about $100,000 on the first day. All other scenarios, which involve some period of time out of the market, failed to get back to even by the end of August.
Much of this is driven by each of the timing scenarios missing out on August 6 — a day in which the Japanese market returned nearly 10% and made up a meaningful portion of the prior day’s loss. But this reinforces a critical risk of overreacting to market anxiety: If you abandon stocks, selling low, you may miss out on the recovery.
Embracing Market Volatility: A Path to Long-Term Success
To be fair, none of this tells us we won’t see more market volatility or other reasons for anxiety going forward. This is just one episode of market volatility, of which there are many we can observe throughout history. In this case, the Japanese market recovered its losses, and broader market volatility quickly eased.
It won’t always happen in the same way. Next time, it might take longer. There might be more ups and downs. Nevertheless, we can take some comfort in knowing that markets have historically faced and overcome these periods of uncertainty. This example is just the latest to remind us of what can go wrong when we let anxiety and emotion dictate our investment decisions.
1 The yen carry trade refers to a trading strategy that grew in popularity during a period of sustained low interest rates in Japan. The trade attempted to benefit from the interest rate differential between Japan and other markets by borrowing cheaply in yen to invest in other market currencies with higher-yielding assets.
Glossary
CBOE Volatility Index (VIX): Tracks the expected 30-day future volatility of the S&P 500 Index.
Federal Reserve (Fed): The Fed is the U.S. central bank, responsible for monetary policies affecting the U.S. financial system and the economy.
Market Capitalization: The market value of all the equity of a company's common and preferred shares. It is usually estimated by multiplying the stock price by the number of shares for each share class and summing the results.
TOPIX 500 Index: Consists of the 500 largest companies in the Tokyo Price Index (TOPIX), which is a capitalization-weighted index of all companies listed on the First Section of the Tokyo Stock Exchange (TSE).
Investment return and principal value of security investments will fluctuate. The value at the time of redemption may be more or less than the original cost. Past performance is no guarantee of future results.
This material has been prepared for educational purposes only. It is not intended to provide, and should not be relied upon for, investment, accounting, legal or tax advice.
The opinions expressed are those of the portfolio team and are no guarantee of the future performance of any Avantis fund.