What Interest Rate Cuts May Mean for Bond Returns

The Federal Reserve (Fed) is on a mission. And by many accounts, that mission is going well.
After inflation rose throughout 2021, the Fed began raising the federal funds rate from near zero in early 2022. By July 2023, the central bank had taken the fed funds target range to 5.25-5.50%, where it has held since. After this rapid rise, the fed funds rate stood at its highest level in 22 years.
Over this time, we observed year-over-year inflation, as measured by the Consumer Price Index, falling from a peak of 9.1% as of June 2022 to 3.4% in December 2023. The Fed’s preferred inflation measure, the Personal Consumption Expenditures Price Index (PCE), ended 2023 at 2.6%. Core PCE, which excludes the more volatile food and energy sectors, ran at an annualized rate below 2% in six of the last seven months of 2023.
Meanwhile, economic growth hasn’t suffered in the way many predicted would follow rising rates. U.S. gross domestic product (GDP) grew 3.1% in 2023, beating many projections from the start of the year. The International Monetary Fund (IMF) projection for U.S. GDP in 2024 is still a healthy 2.1%.1
Calls for a “hard landing” for the economy have simply not materialized. To some, this suggests that the Fed’s tactics have so far proven successful.
In a recent Wall Street Journal opinion piece, renowned economist John Cochrane applauds the Fed for having “engineered a fundamental advance in monetary policy” over the past 15 years.2
In the old days, he says, the Fed raised rates by reducing bank reserves and the amount banks could lend. As a result of tighter money and credit conditions, the economy suffered. In 2008, things changed. The Fed began paying interest on reserves, incentivizing banks to maintain higher levels of reserves and liquidity.
Cochrane argues that this new policy approach seems to have allowed the Fed to raise rates to tame inflation without requiring credit crunches and recessions. And for that, he declares, “the Federal Reserve deserves a pat on the back.”
Multiple Rate Cuts Signaled in 2024
The popular view is that rate cuts are on the near-term horizon. The body officially responsible for monetary policy, the Federal Open Market Committee (FOMC), has suggested three quarter-point rate cuts in 2024. This is based on the median projection of FOMC members, taken in December 2023, on what the fed funds rate would be at year-end.3
At the January FOMC meeting, the Fed offered an update. Fed Chair Jerome Powell said a cut was unlikely at the policymakers’ next meeting in March. However, he was also clear that rate hikes are no longer a consideration for the committee and that rate cuts are still likely to begin in 2024. The question is when and how fast?
Current expectations from interest rate futures offer a perspective on the market’s view. As shown in Figure 1, prices on fed futures contracts suggest a rate cut is the highest probability outcome at the last six FOMC meetings of the year (albeit with a probability of around 60% or less at each meeting).
We can also infer an assigned probability of about 99% for at least four quarter-point rate cuts in 2024 and a 92% probability of five cuts.
Figure 1 | Fed Futures Prices Imply a High Expected Probability of Four or More Rate Cuts in 2024
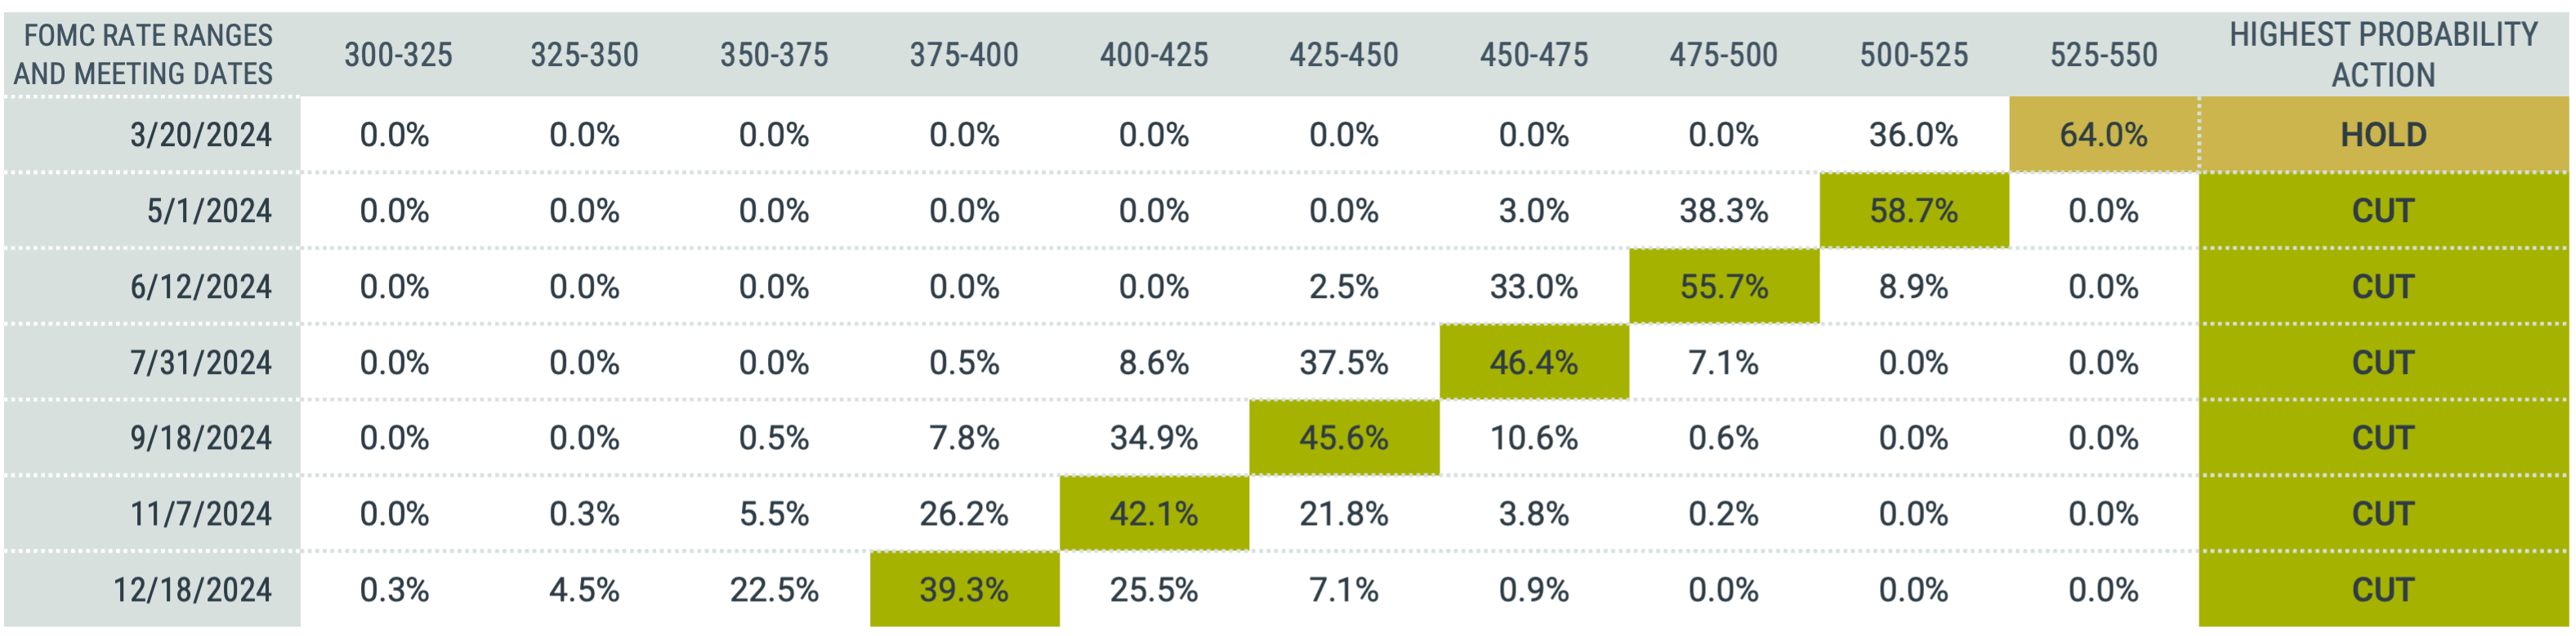
Data as of 1/31/2024. Source: CME FedWatch.
A note of caution: This data can fluctuate daily and meaningfully on new information. However, although there is uncertainty around these projections, the data offer a clear picture of the aggregate market’s belief about the direction of rates.
What Rate Cuts Could Mean for Investors
What does this mean for investors? We believe there are a couple of important potential implications.
Investors who hold significant levels of capital in higher-yielding cash or short-term Treasuries may not enjoy these same yield levels for much longer.
Investors in the longer-duration, broad bond market may stand to benefit.
To illustrate, we looked back at the history of the fed funds rate and ran an experiment to examine how bonds have performed historically during different interest rate environments. Figure 2 shows the fed funds effective rate from 1976, spotlighting the last 25 years. Past periods of rapid rate increases stand out. What’s notable is that these prior periods have been followed by similarly quick rate declines. We include the FOMC median year-end projections in green for the next three years. We see a similar picture forming from the projected rate path.
Figure 2 | Historically, Periods of Rapid Fed Fund Rate Increases Have Been Followed by Quick Declines
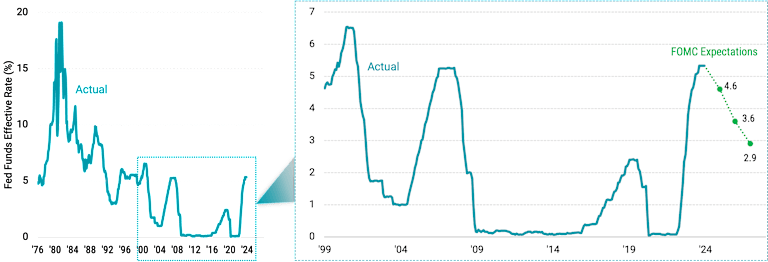
Fed fund effective rate data from 1/1/1976-12/31/2023. Source: FRED. FOMC median projections for year-end 2024-2026. Source: Board of Governors of the Federal Reserve System.
In Figure 3, we present the results of our experiment. To observe how the bond market (or core fixed income) performed in past interest rate environments, we used the Bloomberg US Aggregate Bond Index since its inception in 1976. We calculated returns during three environments: when rates rose by more than 1%, when rates were relatively stable and stayed within plus-or-minus 1%, and when rates fell by more than 1%. We identified each environment over two time horizons: six months and one year.
Figure 3 | Core Fixed Income Has Delivered Meaningfully Higher Returns in Falling Rate Environments
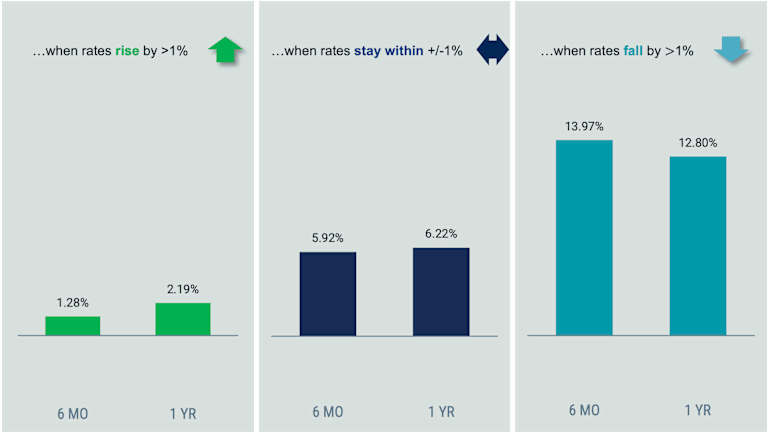
Data from 1/1/1976-12/31/2023. Source: Avantis Investors, Bloomberg, FRED. Number of six-month and one-year periods when rates rise by >1% are 96 and 144, when rates stay within +/- 1% are 372 and 286, and when rates fall by >1% are 102 and 134, respectively. Past performance is no guarantee of future results.
Annualized average returns are positive in all scenarios — even when rates rose by more than 1%. This highlights the multiple components of bond returns, including price appreciation (or depreciation) due to rate or yield changes and the yield itself. While a bond’s price will generally go down as the yield goes up, the bond’s yield can serve as a buffer. Higher yields offer greater protection against total return losses. Given current bond yields, this is good news for investors.
The more salient takeaway for investors today is that in periods when the fed funds rate fell by more than 1%, the bond market delivered meaningfully higher annualized average returns than in more stable and rising interest rate environments.
We offer a different lens on the data in Figure 4, plotting all six-month and one-year observations. We find negative slopes on the trend lines for both periods. While there are a few negative return observations when rates fell by more than 1%, the majority are positive. The charts demonstrate an inverse relation over the sample period with larger short-term rate cuts associated with higher contemporaneous returns from the bond market index.
Figure 4 | Larger Short-Term Rate Cuts Have Historically Meant Higher Returns for Core Fixed Income
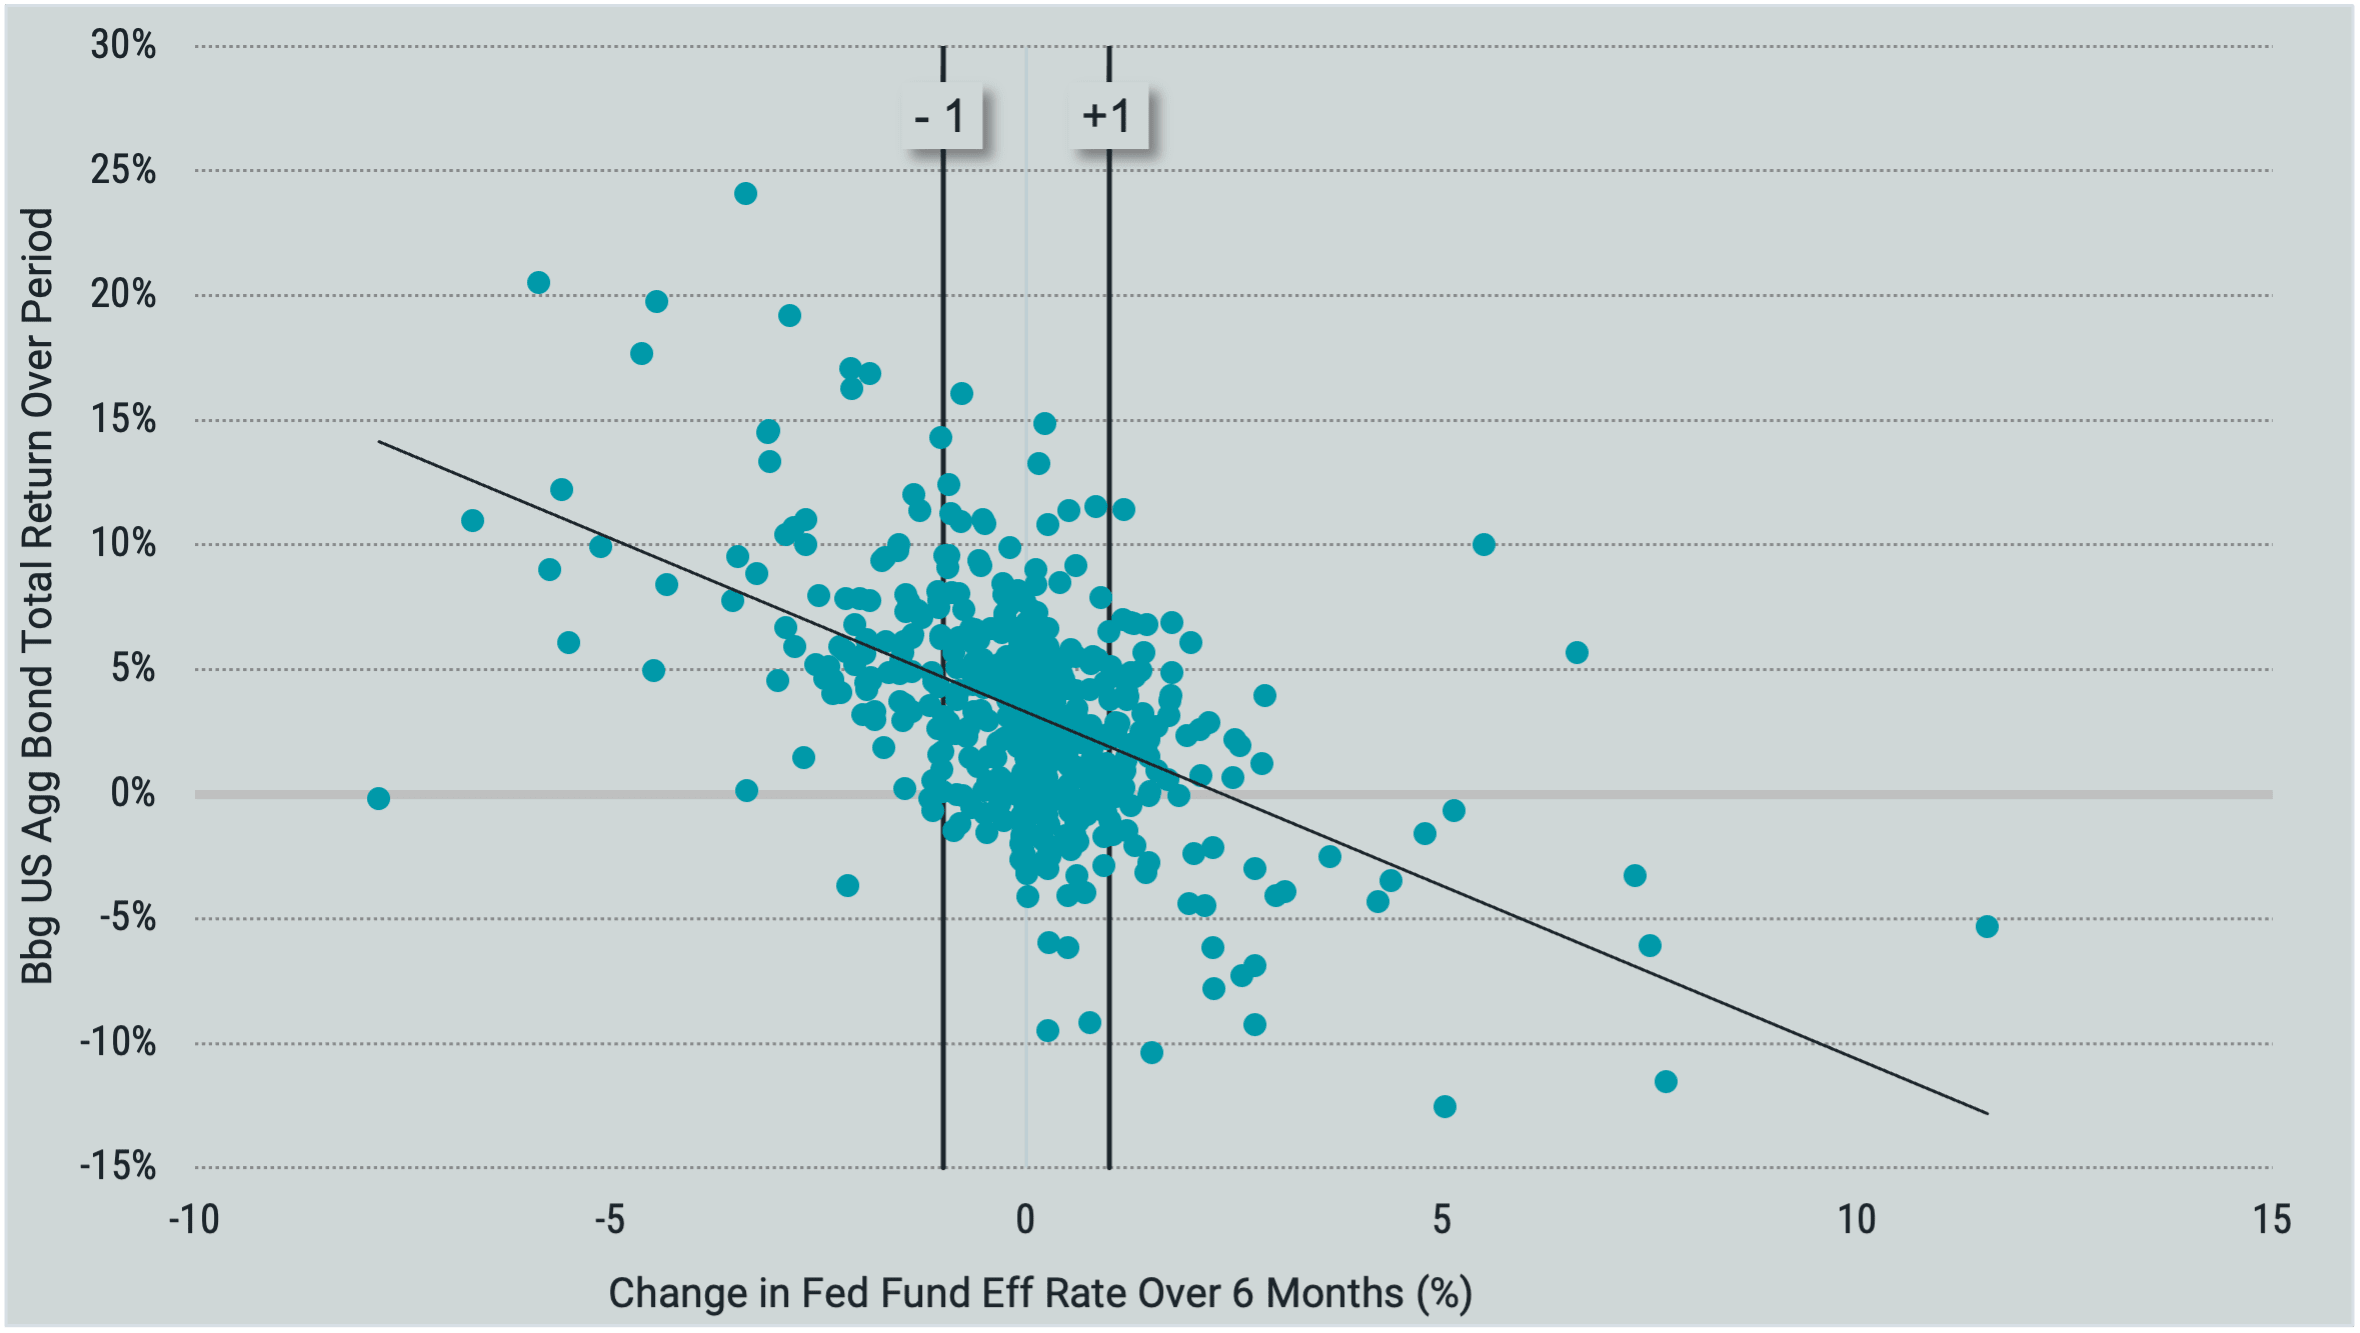
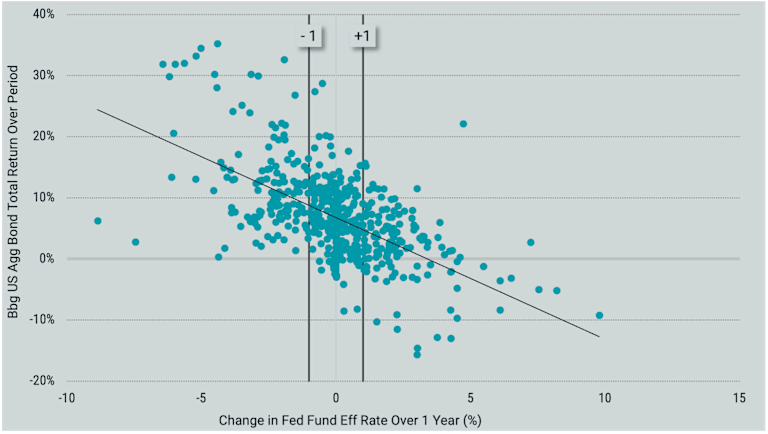
Data from 1/1/1976-12/31/2023. Source: Avantis Investors, Bloomberg, FRED. Number of six-month observations are 570, and one-year observations are 564. Past performance is no guarantee of future results.
It’s worth repeating that the exact pace and magnitude of future potential rate cuts is unknown. We may see rates move slower than current projections for 2024. Or they may move faster.
However, the data are clear that if anything like the path projected by the Fed or implied by the market occurs, a core-like fixed-income allocation would be expected to fare well. Investors who have shifted their portfolios to high levels of cash or short-duration bonds may have good reason to evaluate whether their current allocation is best suited to their goals.
Explore More Insights
Alan Rappeport, “Global Economy Is Heading Toward ‘Soft Landing,’ IMF Says,” New York Times, January 30, 2024.
John H. Cochrane, “The Federal Reserve Deserves a Pat on the Back,” Wall Street Journal, December 26, 2023.
Board of Governors of the Federal Reserve System, “Summary of Economic Projections in Conjunction with the Federal Open Market Committee Meeting of December 12-13, 2023,” December 13, 2023.
Glossary
Bloomberg U.S. Aggregate Bond Index: Represents securities that are taxable, registered with the Securities and Exchange Commission, and U.S. dollar-denominated. The index covers the U.S. investment-grade fixed-rate bond market, with index components for government and corporate securities, mortgage pass-through securities and asset-backed securities.
Central Bank: Entity responsible for oversight of a nation’s monetary system, including policies and interest rates.
Consumer Price Index (CPI): CPI is a U.S. government (Bureau of Labor Statistics) index derived from detailed consumer spending information. Changes in CPI measure price changes in a market basket of consumer goods and services such as gas, food, clothing, and cars. Core CPI excludes food and energy prices, which tend to be volatile.
Duration: Duration is an important indicator of potential price volatility and interest rate risk in fixed income investments. It measures the price sensitivity of a fixed income investment to changes in interest rates. The longer the duration, the more a fixed income investment's price will change when interest rates change. Duration also reflects the effect caused by receiving fixed income cash flows sooner instead of later. Fixed income investments structured to potentially pay more to investors earlier (such as high-yield, mortgage, and callable securities) typically have shorter durations than those that return most of their capital at maturity (such as zero-coupon or low-yielding noncallable Treasury securities), assuming that they have similar maturities.
Expected Returns: Valuation theory shows that the expected return of a stock is a function of its current price, its book equity (assets minus liabilities) and expected future profits, and that the expected return of a bond is a function of its current yield and its expected capital appreciation (depreciation). We use information in current market prices and company financials to identify differences in expected returns among securities, seeking to overweight securities with higher expected returns based on this current market information. Actual returns may be different than expected returns, and there is no guarantee that the strategy will be successful.
Federal Funds Effective Rate: A calculation of the effective median interest rate of overnight federal funds transactions during the previous business day.
Federal Funds Rate (Fed Funds Rate): An overnight interest rate banks charge each other for loans. More specifically, it's the interest rate charged by banks with excess reserves at a Federal Reserve district bank to banks needing overnight loans to meet reserve requirements. It's an interest rate that's mentioned frequently within the context of the Federal Reserve's interest rate policies.
Fed Futures Contracts: An agreement to buy or sell a specific amount of a commodity or financial instrument at a particular price on a stipulated future date, based on the federal funds rate. Futures contracts are typically used as a hedging/risk management tool in portfolio management.
Federal Reserve (Fed): The Fed is the U.S. central bank, responsible for monetary policies affecting the U.S. financial system and the economy.
FOMC (Federal Open Market Committee): This is the committee that sets interest rate and credit policies for the Federal Reserve System, the U.S. central bank. The committee decides whether to increase or decrease interest rates through open-market operations of buying or selling government securities. The committee normally meets about eight times per year.
Gross Domestic Product (GDP): A measure of the total economic output in goods and services for an economy.
International Monetary Fund (IMF): An international organization that promotes global monetary and exchange stability, facilitates the expansion and growth of international trade, and assists in the establishment of a multilateral system of payments for transactions.
Personal Consumption Expenditures (PCE): The PCE price deflator — which comes from the Bureau of Economic Analysis' quarterly report on U.S. gross domestic product — is based on a survey of businesses and is intended to capture the price changes in all final goods, no matter the purchaser. Because of its broader scope and certain differences in the methodology used to calculate the PCE price index, the Federal Reserve holds the PCE deflator as its preferred, consistent measure of inflation over time.
U.S. Treasury securities: Debt securities issued by the U.S. Treasury and backed by the direct “full faith and credit” of the U.S. government. Treasury securities include bills (maturing in one year or less), notes (maturing in two to 10 years) and bonds (maturing in more than 10 years).
Yield: For bonds and other fixed-income securities, yield is a rate of return on those securities. There are several types of yields and yield calculations. "Yield to maturity" is a common calculation for fixed-income securities, which takes into account total annual interest payments, the purchase price, the redemption value, and the amount of time remaining until maturity.
Investment return and principal value of security investments will fluctuate. The value at the time of redemption may be more or less than the original cost. Past performance is no guarantee of future results.
This material has been prepared for educational purposes only. It is not intended to provide, and should not be relied upon for, investment, accounting, legal or tax advice.
The opinions expressed are those of the portfolio team and are no guarantee of the future performance of any Avantis fund.
Generally, as interest rates rise, the value of the bonds held in the fund will decline. The opposite is true when interest rates decline.