
Heavy Weights: The Real Story Behind Current Market Concentration
Key Takeaways
Current market concentration levels in the U.S. are the highest observed in the past 35 years.
The value side of the market shows much lower concentration levels.
Diversification remains a key strategy that can help reduce exposure to the risks associated with high market concentration.
Two years ago, the concentration of the U.S. stock market in its largest companies looked high compared to recent history. Today, some might say market concentration appears really high.
At the end of 2024, the 10 largest companies in the S&P 500® Index made up 37.3% of the index by market capitalization. This means that just 2% of the 500 largest U.S. companies represent nearly 40% of the weight.
What’s happened with large growth companies is even more remarkable. The top 10 stocks in the Russell 1000® Growth Index accounted for a whopping 61.3% at year-end. This puts the average weight of the 10 largest companies at about 6.1%, while the other 386 companies in the large growth index average just 0.1%.
If we compare U.S. large-cap indexes today versus the recent past (see Figure 1), it’s clear that concentration levels at the top of the S&P 500 and Russell 1000 Growth are now far higher than at any point observed in the last 35 years. The previous high mark over this period, around the height of the dot-com era in early 2000, appears small in comparison.
Figure 1 | Top 10 Weight in U.S. Large and Large Growth Indexes Is Highest in Last 35 Years
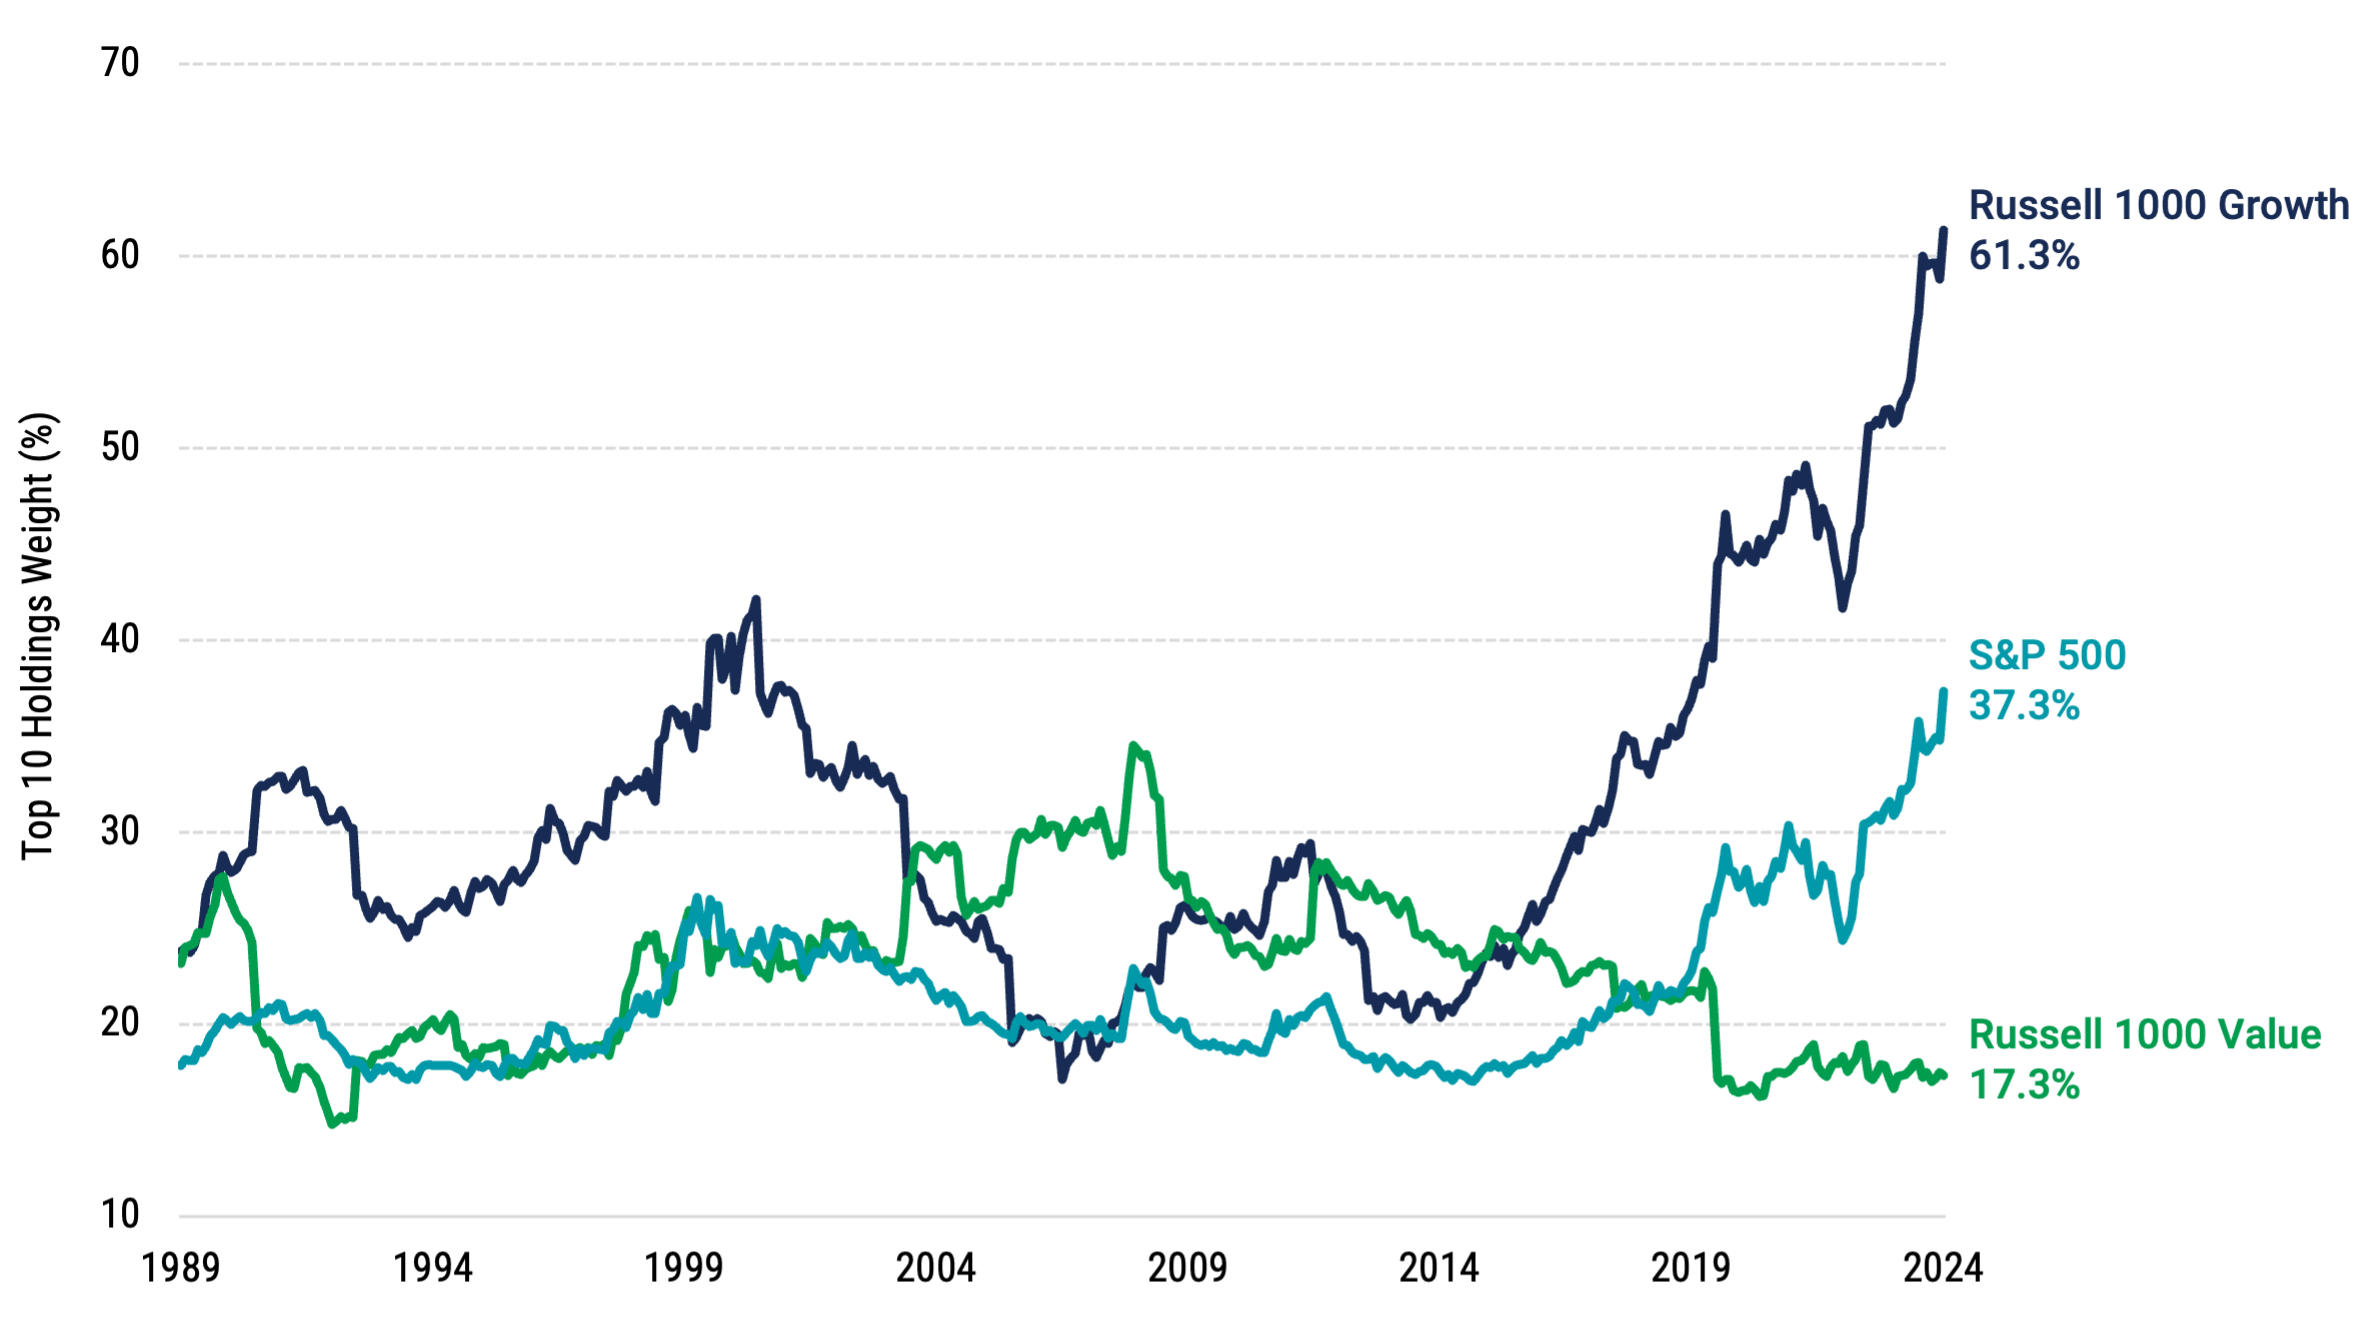
Data from 12/31/1989 - 12/31/2024. Source: Morningstar.
The value side of the market, measured by the Russell 1000® Value Index, remains in stark contrast. The top 10 weight today for the large value index (17.3%) is almost exactly half of its prior peak (34.5%) in late 2008.
Understanding the Prevalence of Market Concentration
While 35 years isn’t a short period, the U.S. market has, of course, more history. Various researchers and practitioners have endeavored to collect data going further back in time, beyond what is captured by well-known indexes like the S&P 500. Their findings show that there have been periods in the past when the top 10 weight levels in the U.S. market were similar to today.
For example, the top 10 weight is believed to have been nearly 40% at the start of the 20th century and more than 30% for much of the 1930s and early 1940s. Then again, during the 1950s and early 1960s.1 These concentration levels persisted for extended periods before subsiding, suggesting that high concentration today isn’t alone likely to be a strong predictor of an imminent shift to concentration levels.
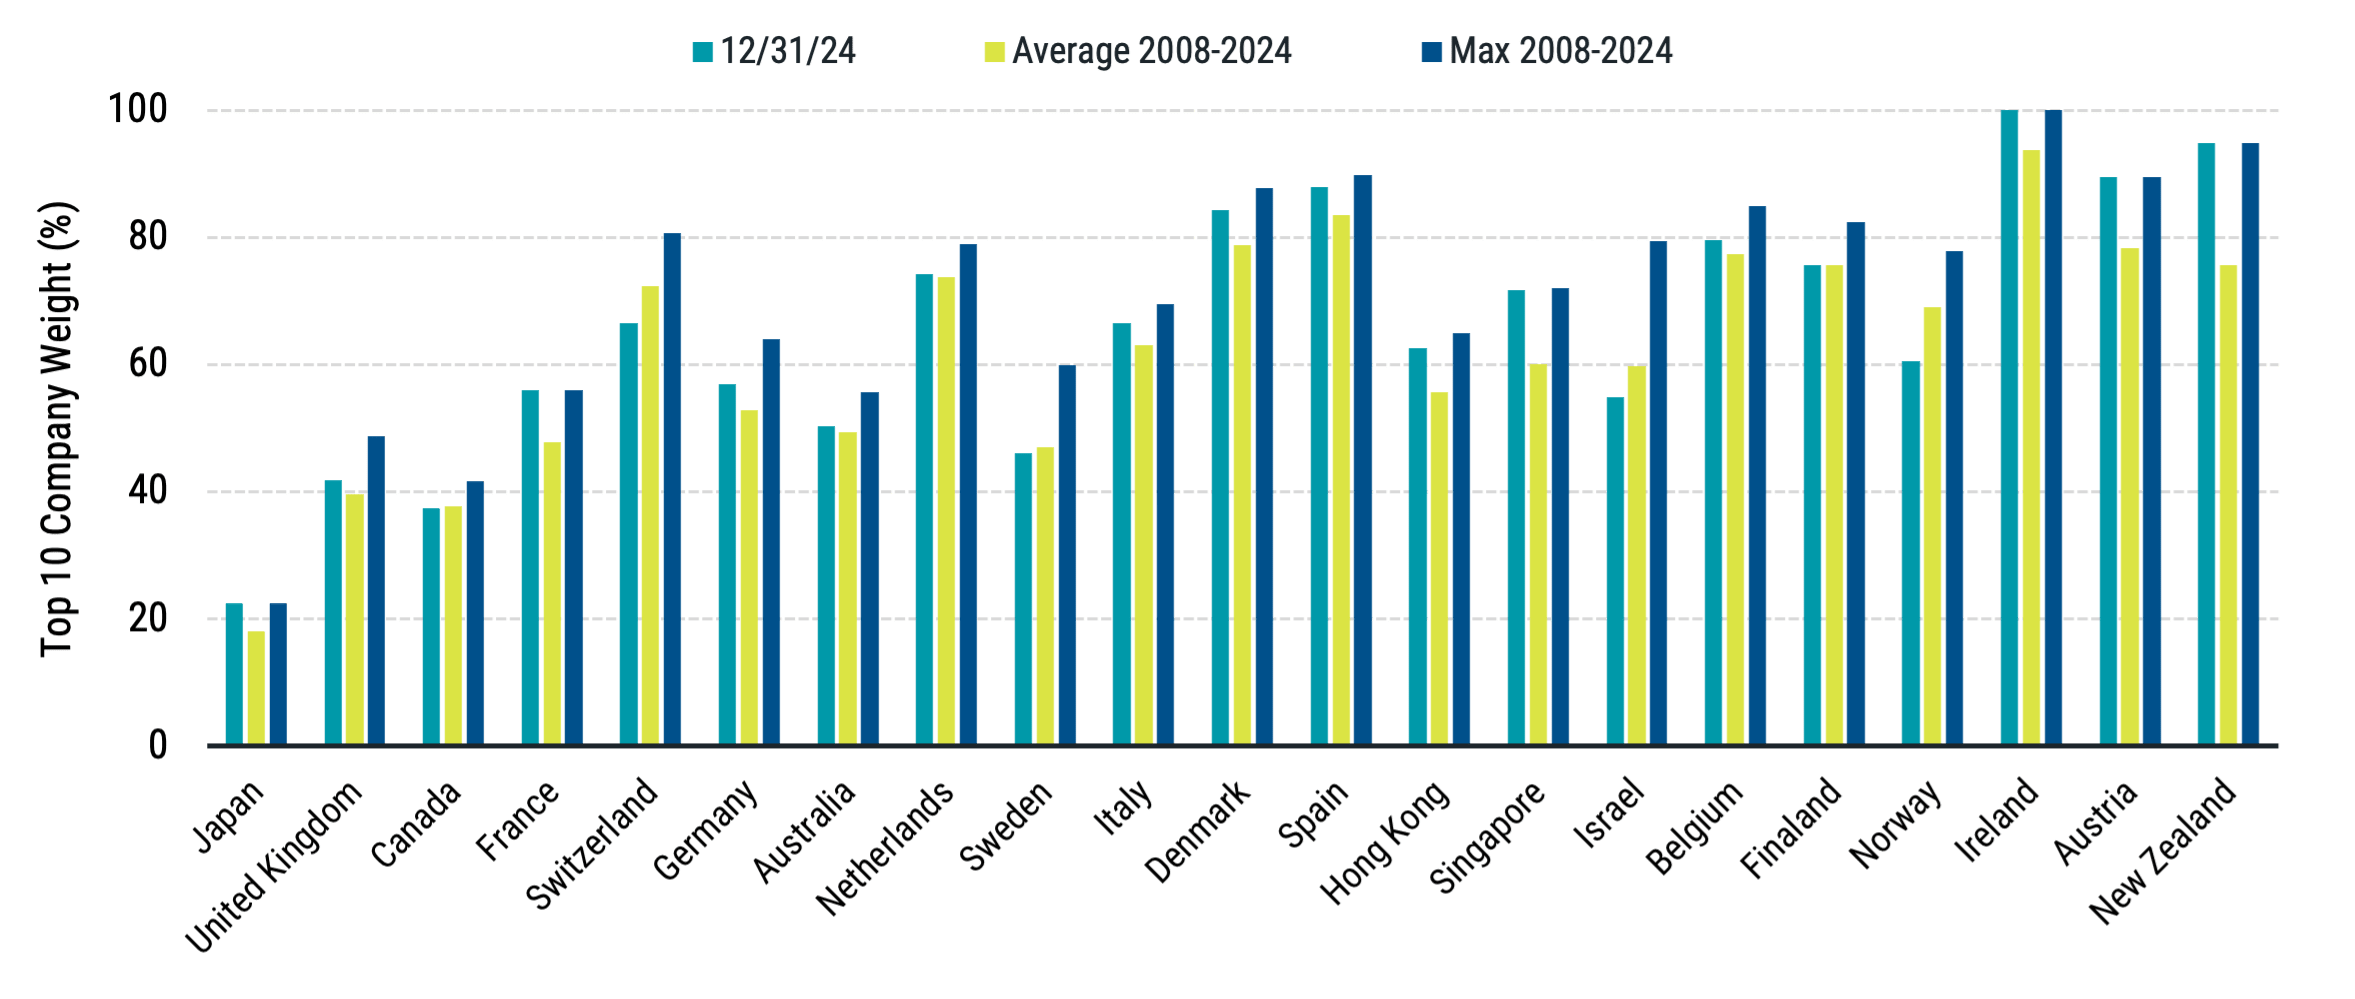
Further, if we look at other countries worldwide (see Figure 2), many are even more concentrated than the U.S. today and have been over time. So, concentration within individual markets isn’t uncommon. However, putting all developed and emerging markets together, the top 10 weight falls to about 20%.
Figure 2 | Many Markets Around the World Are More Concentrated Than the U.S.
Panel A | Developed Non-U.S. Markets
Panel B | Emerging Markets
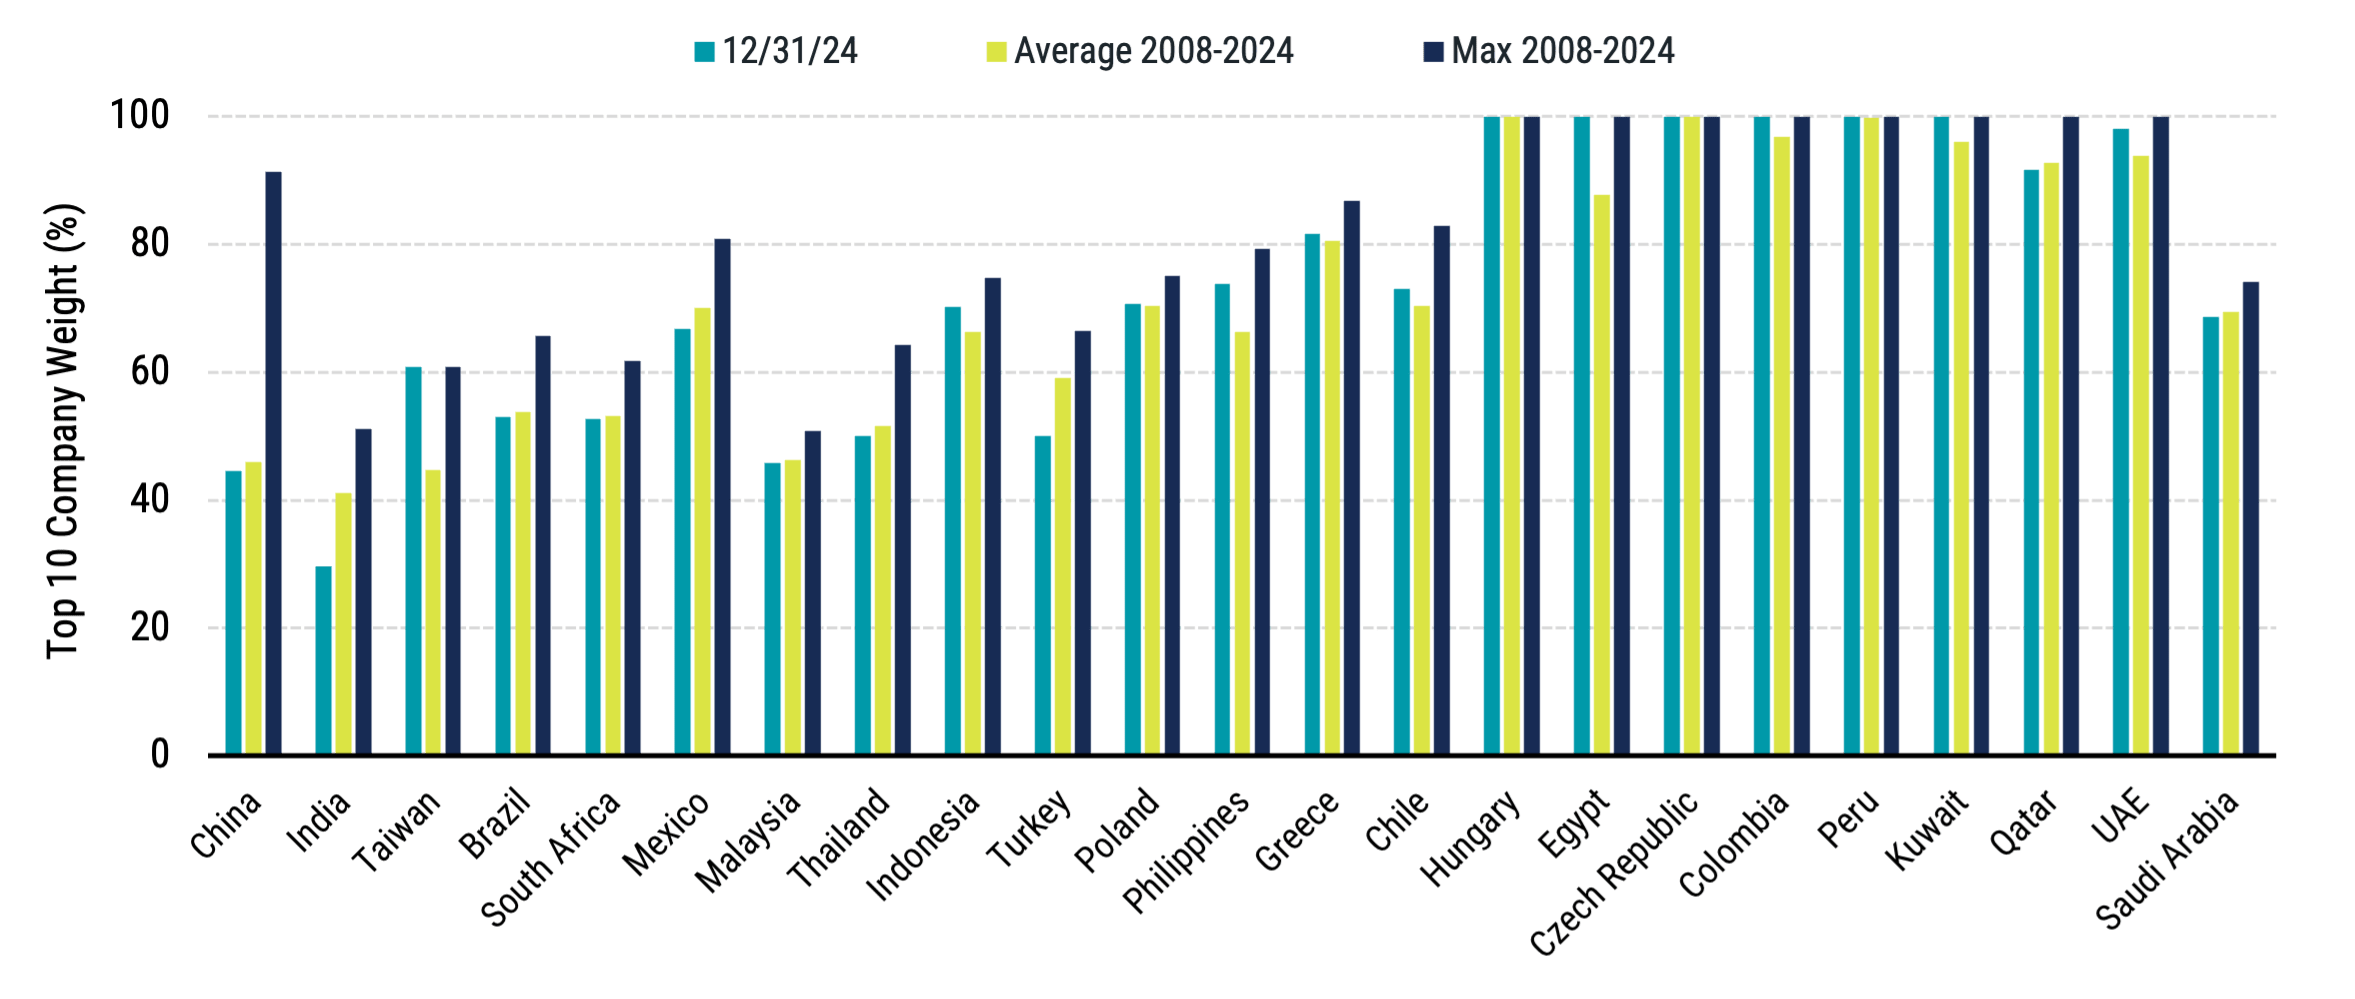
Data for Panel A and Panel B from 3/1/2008 - 12/31/2024. Source: Morningstar.
Drivers of Current U.S. Market Concentration
What makes today’s concentration levels in the U.S. worth our attention is how we got here. A handful of big companies, often called the Magnificent 7 (Mag 7) stocks, had unexpectedly high price increases and became an even larger fraction of the total U.S. market capitalization.
In Figure 3, we can see that the growth of a dollar over the last two years for those 7 mega-cap growth companies was significantly higher than for the remaining companies in the large-cap market (S&P 500 ex Mag 7). The Mag 7 played a large role in lifting the return of the S&P 500.
Figure 3 | The Mag 7 Stocks Drove Much of the U.S. Market Return the Last Two Years
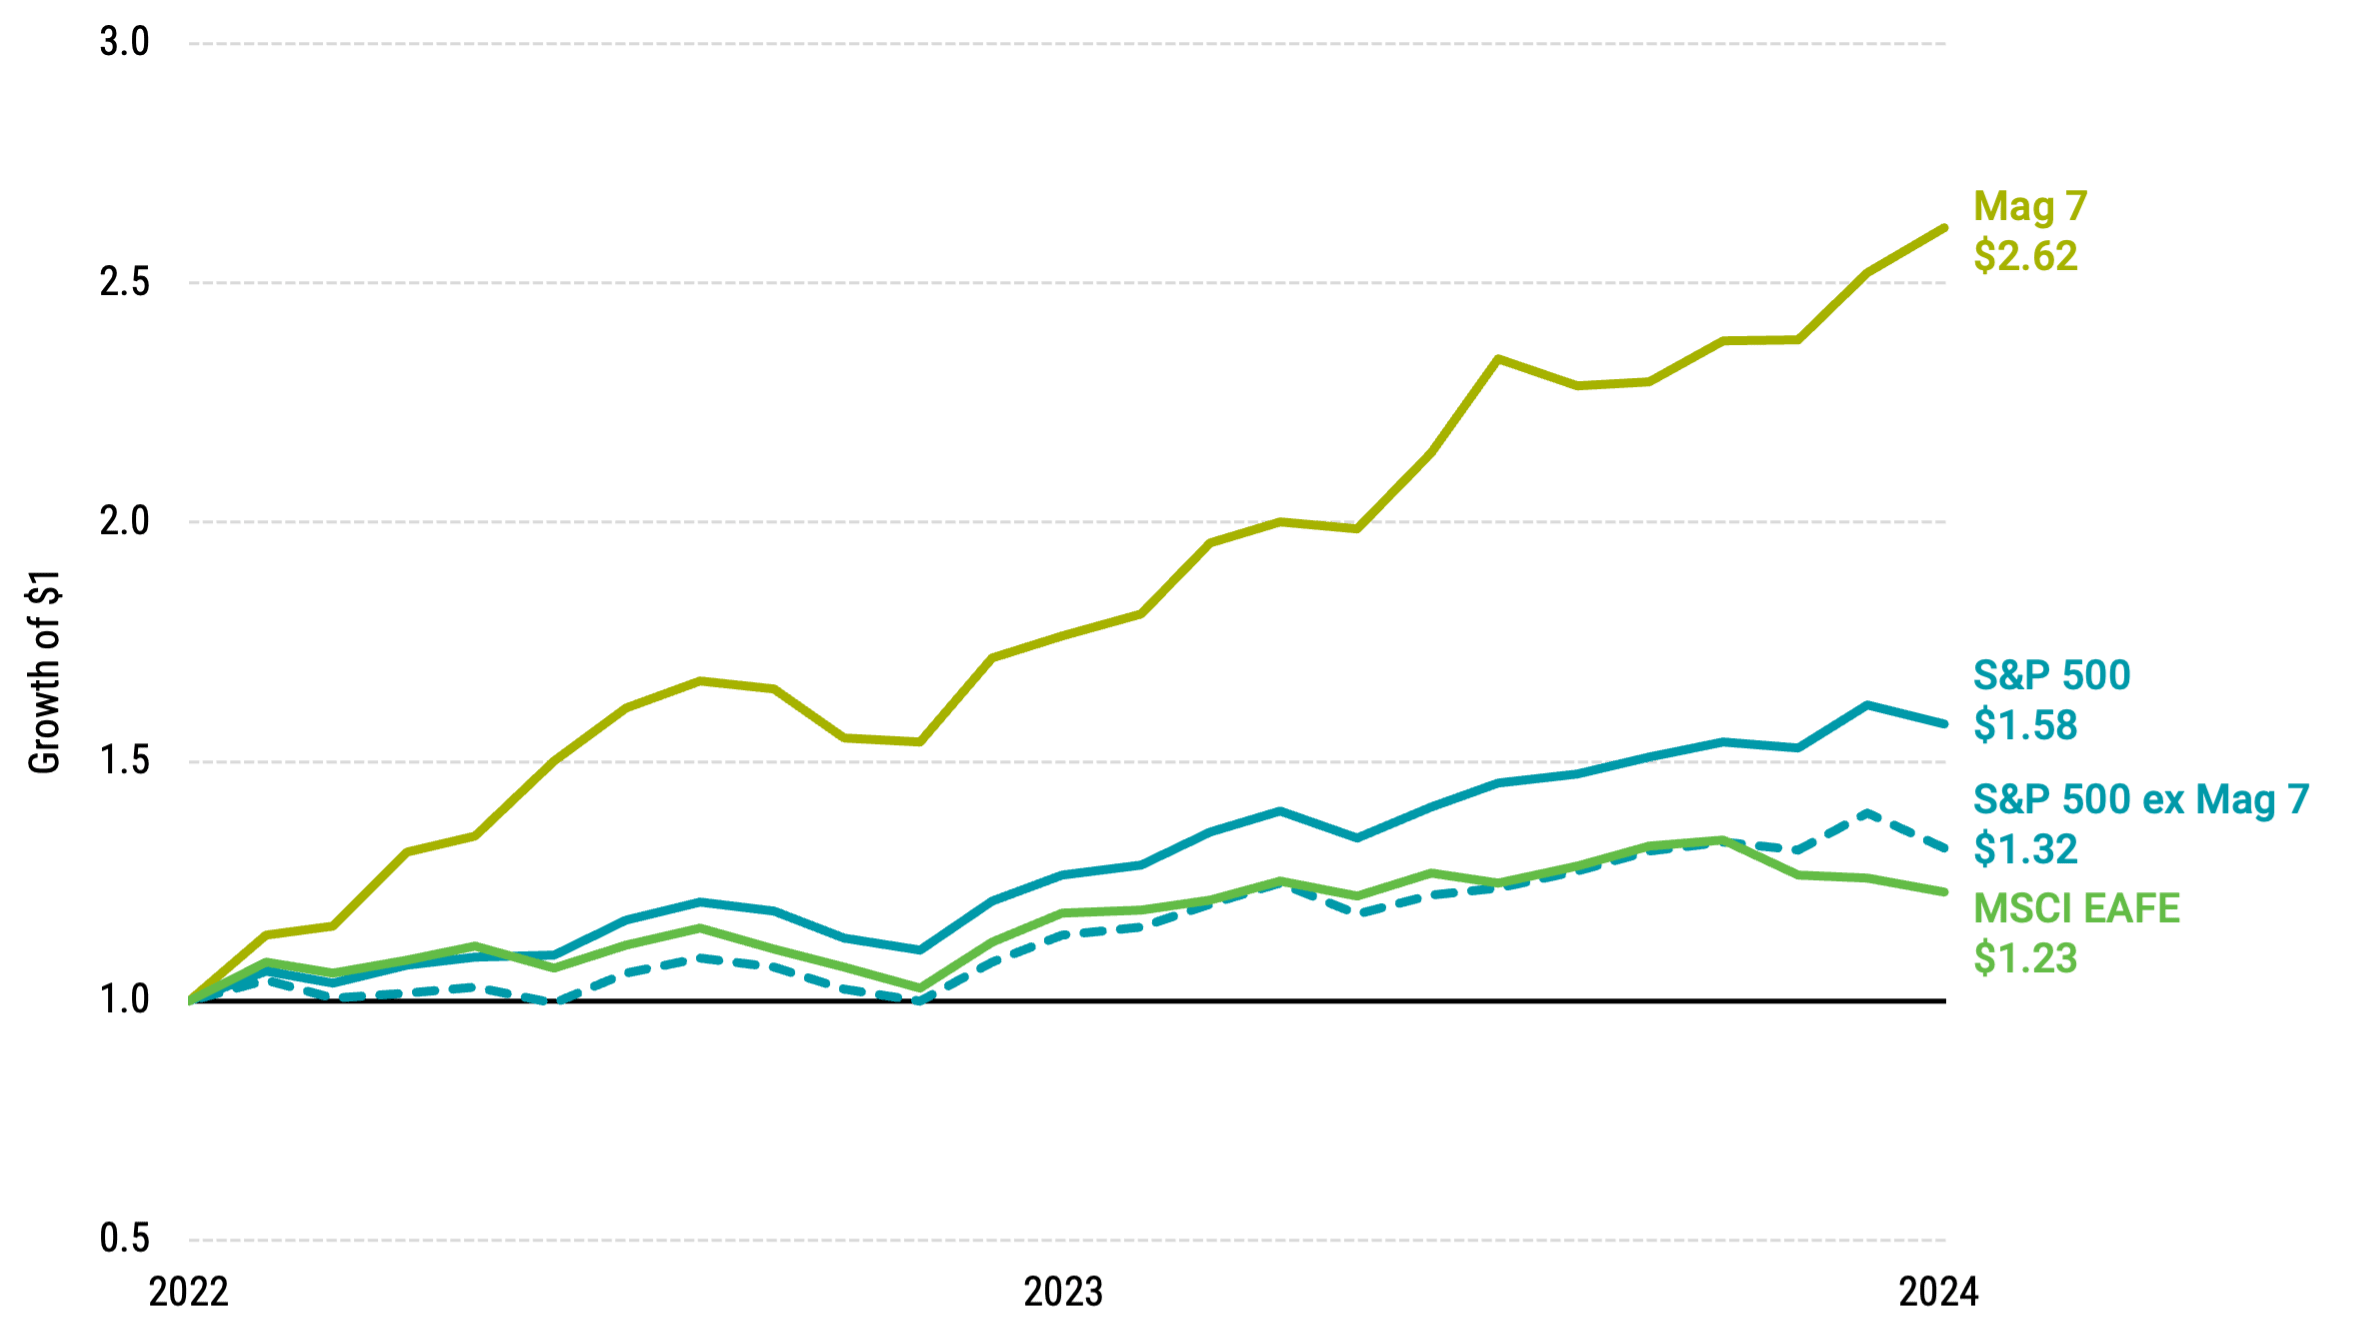
Data from 12/31/2022 - 12/31/2024. Source: Bloomberg, Avantis Investors. Past performance is no guarantee of future results.
Without the Mag 7, the remaining companies in the index performed strikingly similar to international developed stocks (MSCI EAFE Index) over this time, returning slightly above 11% per year (marginally above the long-term historical average).
Can we explain what underlying factors have influenced the outperformance of these companies at the top of the U.S. market — those largely responsible for the rise of market concentration levels?
Well, while earnings have been strong for many of the Mag 7 companies and among U.S. large-cap and large-cap growth stocks in aggregate, prices have, on average, gone up far more. This means that the expansion of valuation multiples, like price-to-earnings (P/E), has played a big role.2 Figure 4 demonstrates.
Figure 4 | Rise in Large-Cap Growth Valuations Has Coincided with Higher Concentration
Panel A | Russell 1000 Growth P/E Today vs. Last 25-Year Average
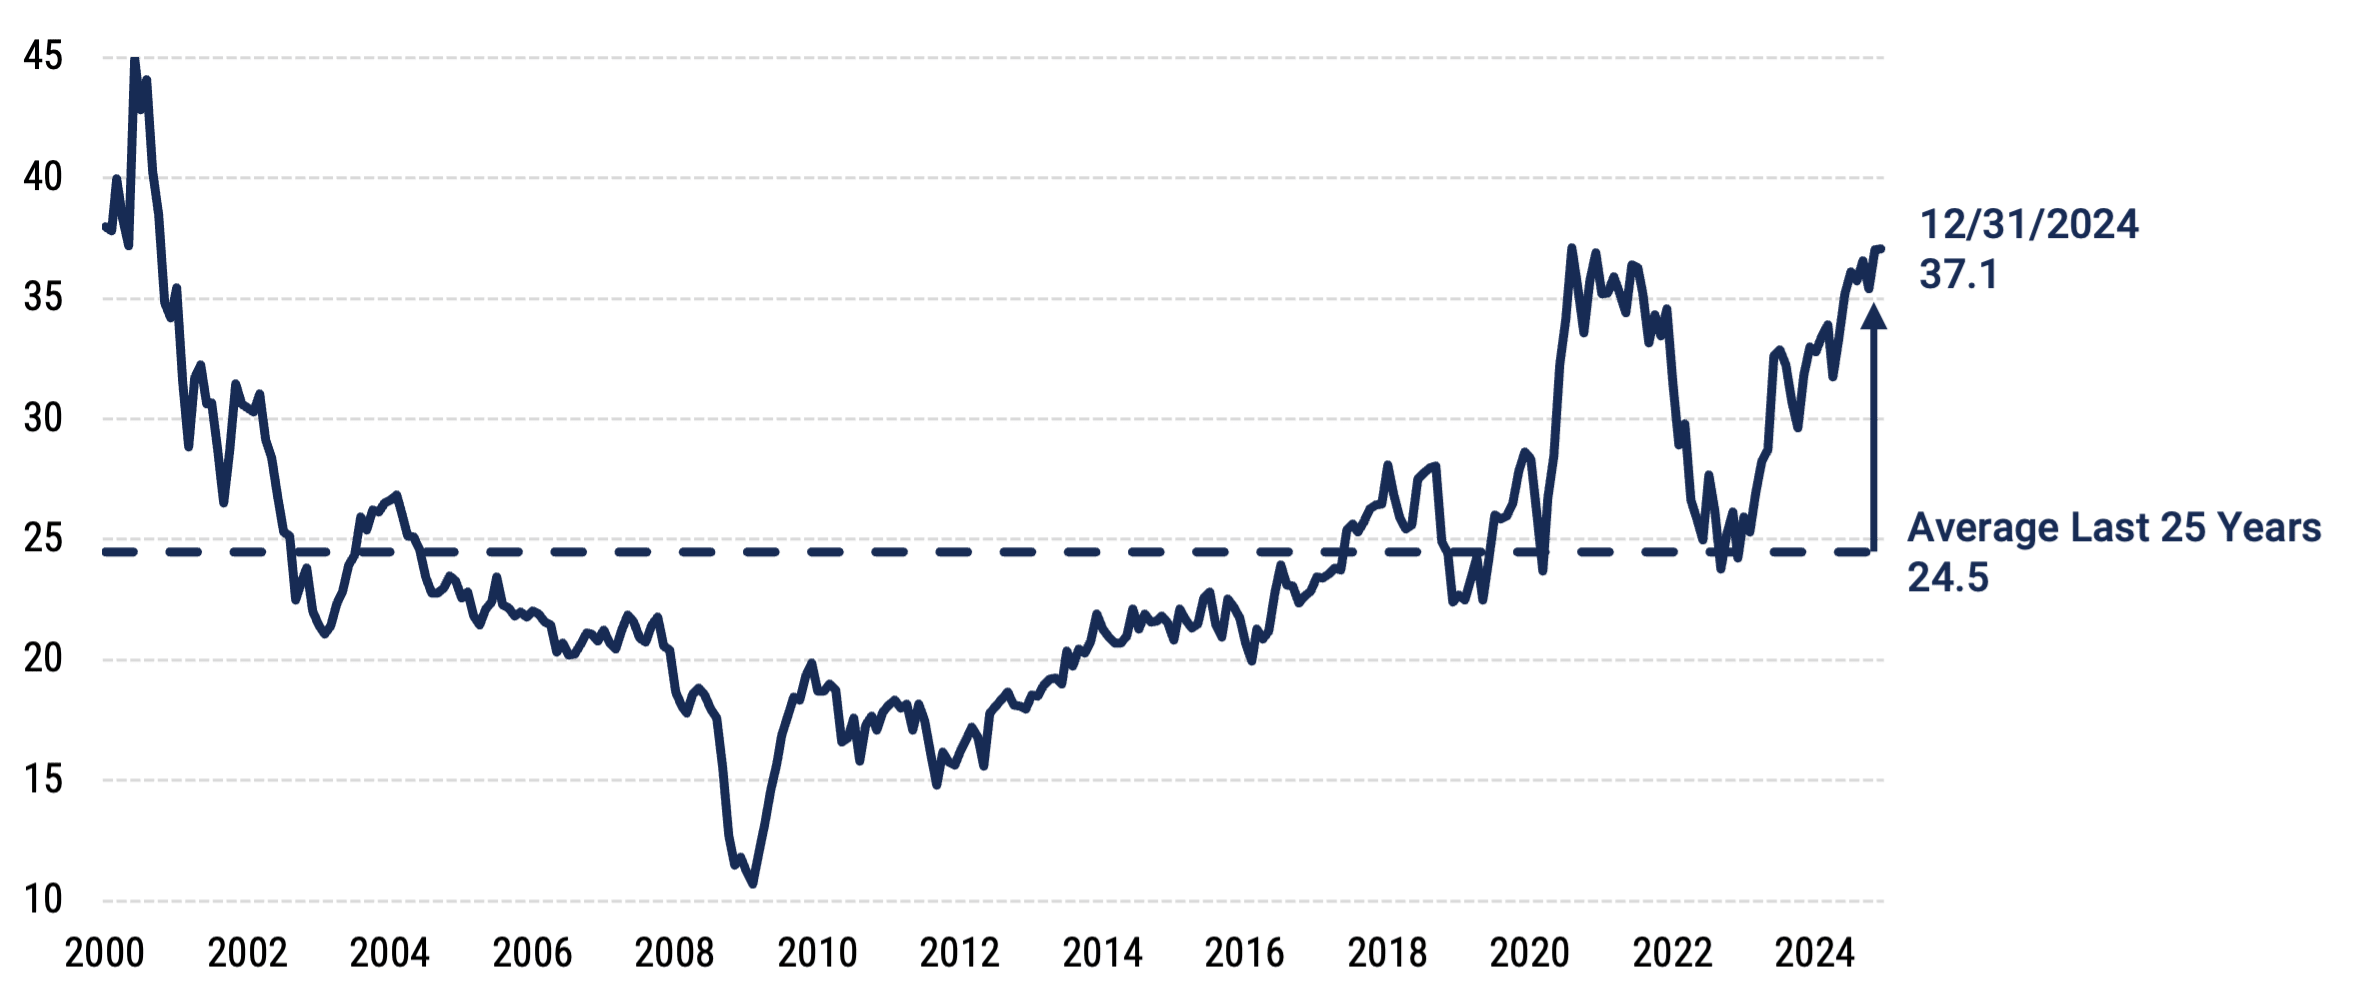
Panel B | S&P 500 Index P/E Today vs. Last 25-Year Average
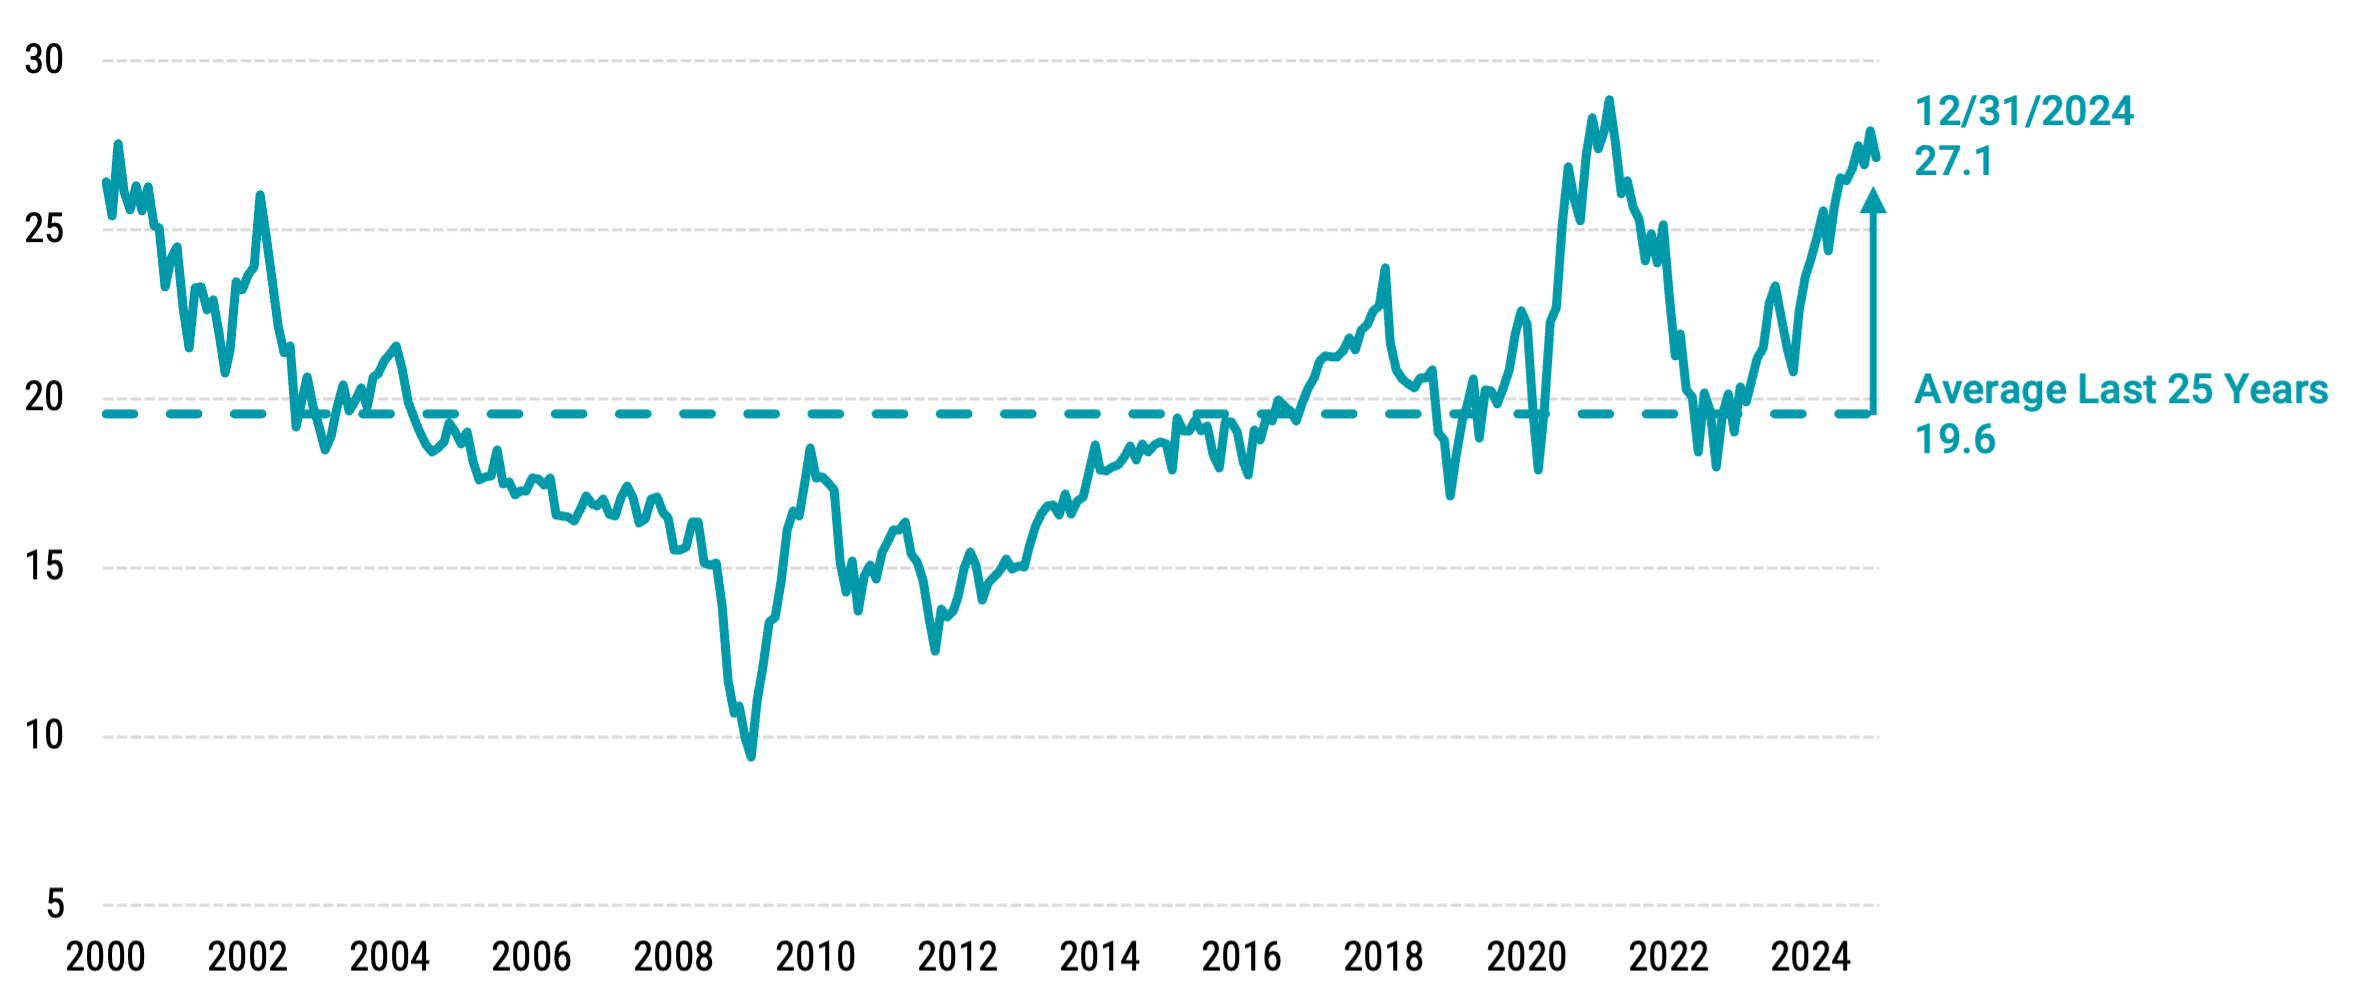
Data for Panel A and Panel B from 1/1/2000 – 12/31/2024. Source: Morningstar. Past performance is no guarantee of future results.
For current valuations to be justified for the Mag 7 and large growth stocks more broadly, very large earnings growth will have to continue. So, the real story is higher levels of concentration in stocks with well-above-average valuations. While market concentration has felt high the last few years, and valuations at the top of the market have, too, what’s different today is that the magnitudes are even greater.
Lessons from Historical Top Stock Performance
We’ve shown that the largest U.S. stocks have outperformed the last few years, but that’s certainly not always been the case. In Figure 5, we show the difference in returns through time between the S&P 500 Index, which weights by market cap giving bigger companies bigger representation than smaller companies, versus equally weighting all companies in the index. When larger companies in the index do well relative to the rest of the market, the market-cap-weighted index will outperform the equally weighted return.
Figure 5 | Outperformance From the Top of the Market Hasn't Persisted Historically
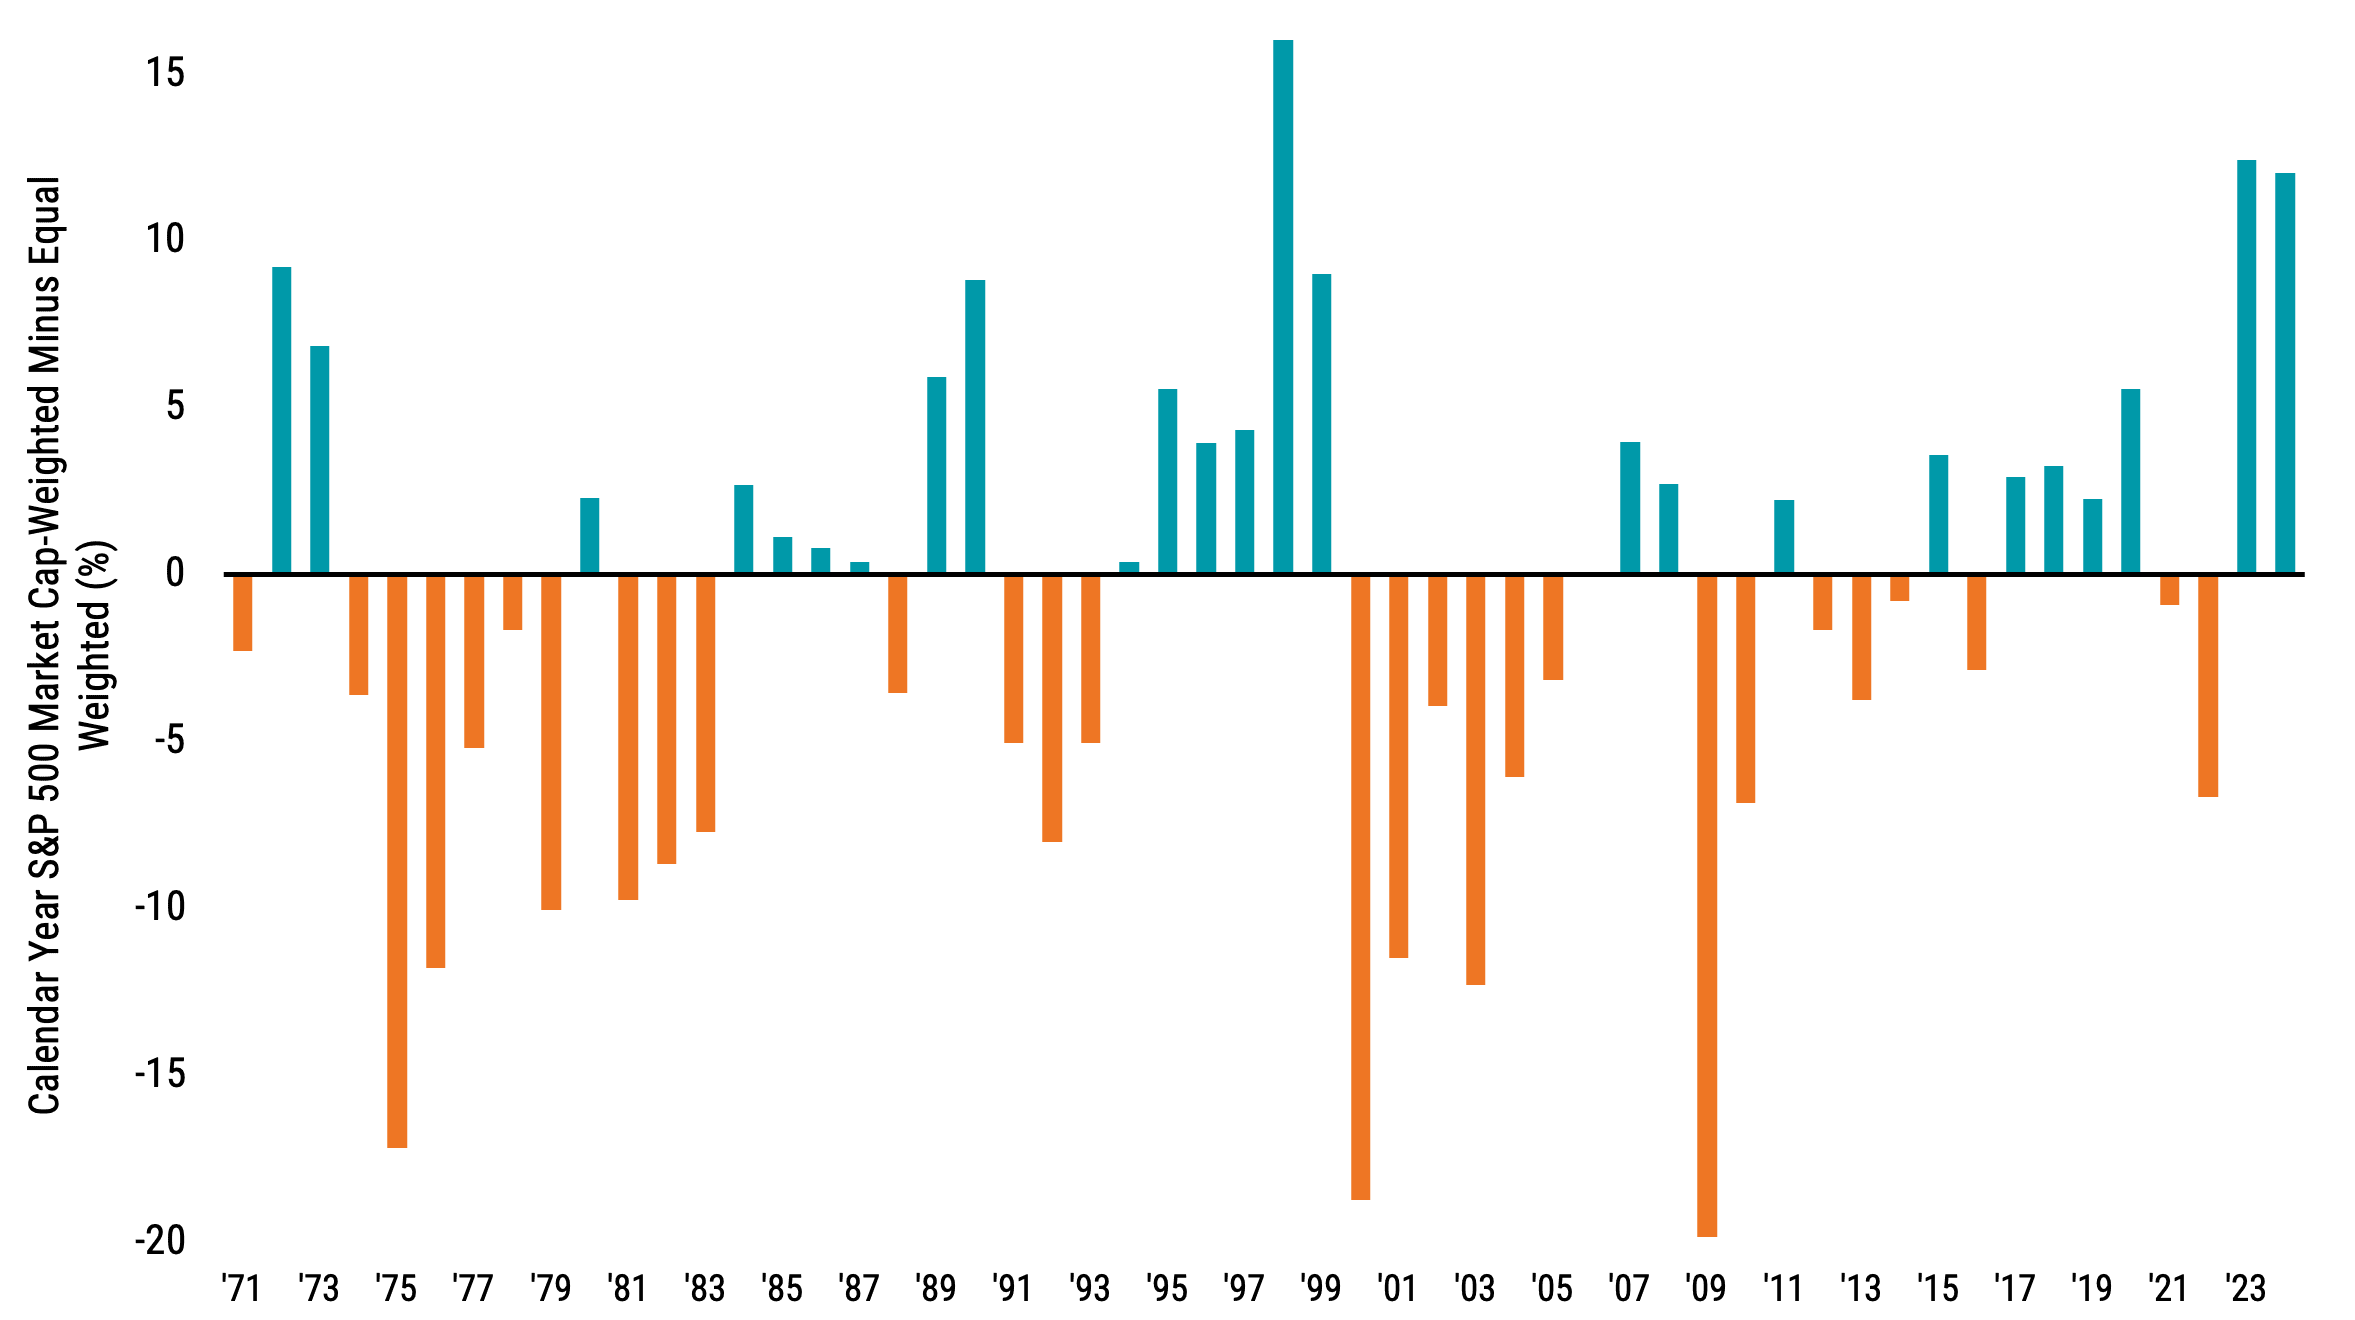
Data from 1971 – 2024. Source: Morningstar. Past performance is no guarantee of future results.
The last time we observed elevated concentration combined with elevated valuations, around the start of the century, what followed was outperformance from the equally weighted approach. While equal weighting is far from an effective and holistic long-term strategy (all companies are given the same weight regardless of whether their valuations are attractive), this comparison helps illustrate that outperformance from the top of the market hasn’t persisted historically.
Important Lessons for Investors
The key point is that concentration in isolation doesn’t tell you about future expected returns, but valuations do.3 So, as investors, what can we do about it within our portfolios?
Pay attention to valuations.
Diversify.
Consider that there’s far more to the global opportunity set than just seven companies, or even all 500 in the S&P 500, and rising valuations at the top of the U.S. market haven’t been matched in other areas of the global market. Today's U.S. small-cap and international stock valuation ratios look quite similar to their long-term average, contributing to their attractiveness relative to the high prices within the U.S. large-cap market.
This doesn’t mean we should avoid the largest U.S. companies entirely. They’re still a big part of the market, and given their current size, not holding them would mean a very different return experience through time than the overall market. However, “doubling down” by ignoring valuations and meaningfully overweighting the Mag 7 or S&P 500 Index is the other end of the extreme.
Think about the impact of Nvidia's recent decline, one of the largest companies in the world, following the introduction of DeepSeek. It reminds us that innovations and disruptions can come from anywhere and without notice.
Diversification can help limit the effect of such events. By diversifying, you know you won’t have the highest return over any period, but you also have protection from having the lowest return. And if those very big, high-priced companies fail to continue to deliver unexpectedly strong performance going forward, being diversified across company sizes, global markets and valuation profiles may make a big difference.
While it’s reasonable to look back in hindsight and be tempted to think that we could have had better returns by “only” investing in the best-performing country, sector or stock, we should be careful not to 1) think this means that what has recently done well will prove to generate the best future outcome and 2) confuse this with the idea that diversification “hasn’t worked.”
Endnotes
1 Jason Zweig, “What Amazon’s Rise to No. 1 Says About the Stock Market,” Wall Street Journal, January 11, 2019; Elroy Dimson, Paul Marsh, and Mike Staunton, Triumph of the Optimists: 101 Years of Global Investment Returns (Princeton, NJ: Princeton University Press, 2002): 28-32.
2 Avantis Investors, “What Today’s Valuations are Telling Investors,” October 2024.
3 Avantis Investors. “Focus on Horizon: Tuning Out the Noise with Valuations and Returns.” August 2023.
Glossary
Expected Returns: Valuation theory shows that the expected return of a stock is a function of its current price, its book equity (assets minus liabilities) and expected future profits, and that the expected return of a bond is a function of its current yield and its expected capital appreciation (depreciation). We use information in current market prices and company financials to identify differences in expected returns among securities, seeking to overweight securities with higher expected returns based on this current market information. Actual returns may be different than expected returns, and there is no guarantee that the strategy will be successful.
Magnificent Seven: This phrase refers to seven stocks that have been high-performing in the technology sector — Alphabet, Amazon, Apple, Meta Platforms, Microsoft, NVIDIA and Tesla.
Market Capitalization: The market value of all the equity of a company's common and preferred shares. It is usually estimated by multiplying the stock price by the number of shares for each share class and summing the results.
MSCI EAFE Index: Designed to measure developed market equity performance, excluding the U.S. and Canada.
Price-to-Earnings Ratio (P/E): The price of a stock divided by its annual earnings per share. These earnings can be historical (the most recent 12 months) or forward-looking (an estimate of the next 12 months). A P/E ratio allows analysts to compare stocks on the basis of how much an investor is paying (in terms of price) for a dollar of recent or expected earnings. Higher P/E ratios imply that a stock's earnings are valued more highly, usually on the basis of higher expected earnings growth in the future or higher quality of earnings.
Russell 1000® Growth Index: Measures the performance of those Russell 1000 Index companies (the 1,000 largest publicly traded U.S. companies, based on total market capitalization) with higher price-to-book ratios and higher forecasted growth values.
Russell 1000® Value Index: Measures the performance of those Russell 1000 Index companies (the 1,000 largest publicly traded U.S. companies, based on total market capitalization) with lower price-to-book ratios and lower forecasted growth values.
S&P 500® Index: A market-capitalization-weighted index of the 500 largest U.S. publicly traded companies. The index is widely regarded as the best gauge of large-cap U.S. equities.
Diversification does not assure a profit nor does it protect against loss of principal.
Investment return and principal value of security investments will fluctuate. The value at the time of redemption may be more or less than the original cost. Past performance is no guarantee of future results.
This material has been prepared for educational purposes only. It is not intended to provide, and should not be relied upon for, investment, accounting, legal or tax advice.
The opinions expressed are those of the portfolio team and are no guarantee of the future performance of any Avantis fund.
References to specific securities are for illustrative purposes only and are not intended as recommendations to purchase or sell securities. Opinions and estimates offered constitute our judgment and, along with other portfolio data, are subject to change without notice.
©2025 Morningstar, Inc. All Rights Reserved. Certain information contained herein: (1) is proprietary to Morningstar and/or its content providers; (2) may not be copied or distributed; and (3) is not warranted to be accurate, complete or timely. Neither Morningstar nor its content providers are responsible for any damages or losses arising from any use of this information.