Has Passive Investing Gotten Too Big?

Key Takeaways
Passive investing has grown significantly in recent years, raising questions about its impact on market dynamics and individual stock prices.
Passive funds make up just one segment of the stock ownership landscape, which also includes direct holdings by retail and institutional investors.
Truly passive investments don’t affect the relative demand for stocks and, therefore, shouldn’t significantly impact relative price movements.
The growing market share of passive investments has been a continuing theme in the fund industry over the past few decades. Passive funds are often thought of as mutual funds or exchange-traded funds (ETFs) that track a periodically rebalanced, market-capitalization-weighted index.
In August 1996, 20 years after the launch of the first publicly available index fund, passive funds represented only 6% of U.S.-domiciled equity mutual fund and ETF assets. Active, non-index tracking funds held 94%. As of the end of May 2024, passive mutual funds and ETF assets have grown to nearly 60% of the equity fund market.
Figures such as these, along with the common perception that all passive investors are buying and holding the market and thereby no longer actively trading in stocks, have brought about questions about the potential impact passive investing may have on market prices. Periods when a subset of companies rise rapidly in price and valuations, such as the Magnificent 7 stocks of late, may also contribute to investor curiosity. Some claim that perhaps more money flowing into index funds that hold these companies is the driving force for the dramatic price increases in those few mega-cap companies with very high prices.
Figure 1 | Passive Fund Assets Have Grown Exponentially Over the Past Several Decades
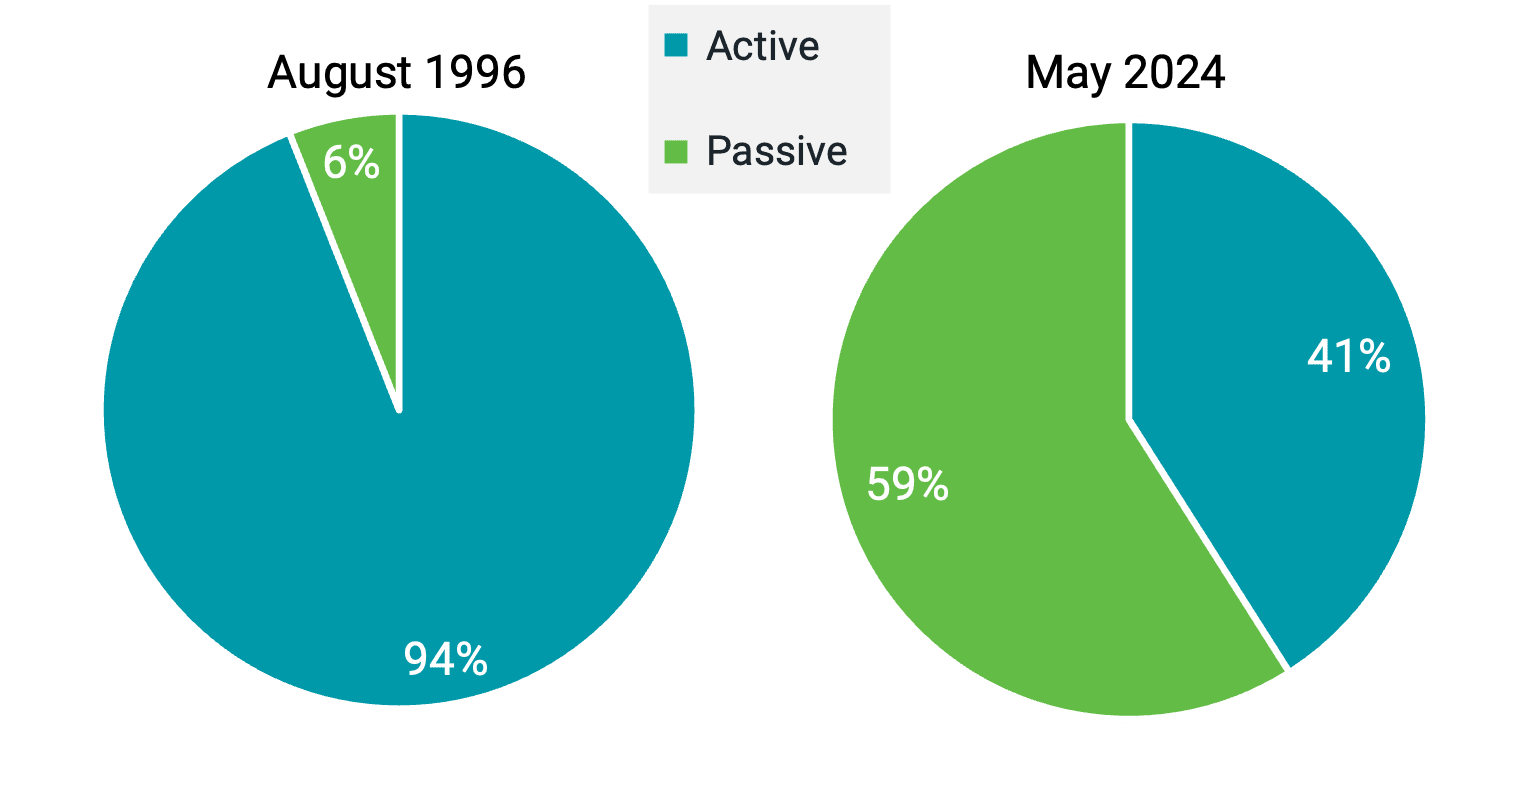
Data as of 5/31/2024. Source: Morningstar.
While the growth of passive funds has been a remarkable trend to watch, we believe that’s all it is. Truly passive investments don’t affect relative demand for the ownership of companies and so shouldn’t have a significant effect on relative price movements, or in other words, drive price changes in some companies more than others. We explain why.
Mutual Funds and ETFs Aren’t the Only Owners of Stocks
First, it’s important to recognize that all securities are owned by investors, not only through funds but also directly, such as those held directly by retail and institutional investors. Considering the share of index fund ownership of all securities in the market versus just within the fund industry meaningfully changes the picture.
At the end of 2023, index-tracking mutual funds and ETFs were measured to hold only 18% of U.S. stocks. Figure 2 shows how this has evolved. Index funds have increased their share primarily at the expense of active funds, not direct holdings.
Figure 2 | Index Funds’ Share of the Total U.S. Stock Market Is Small
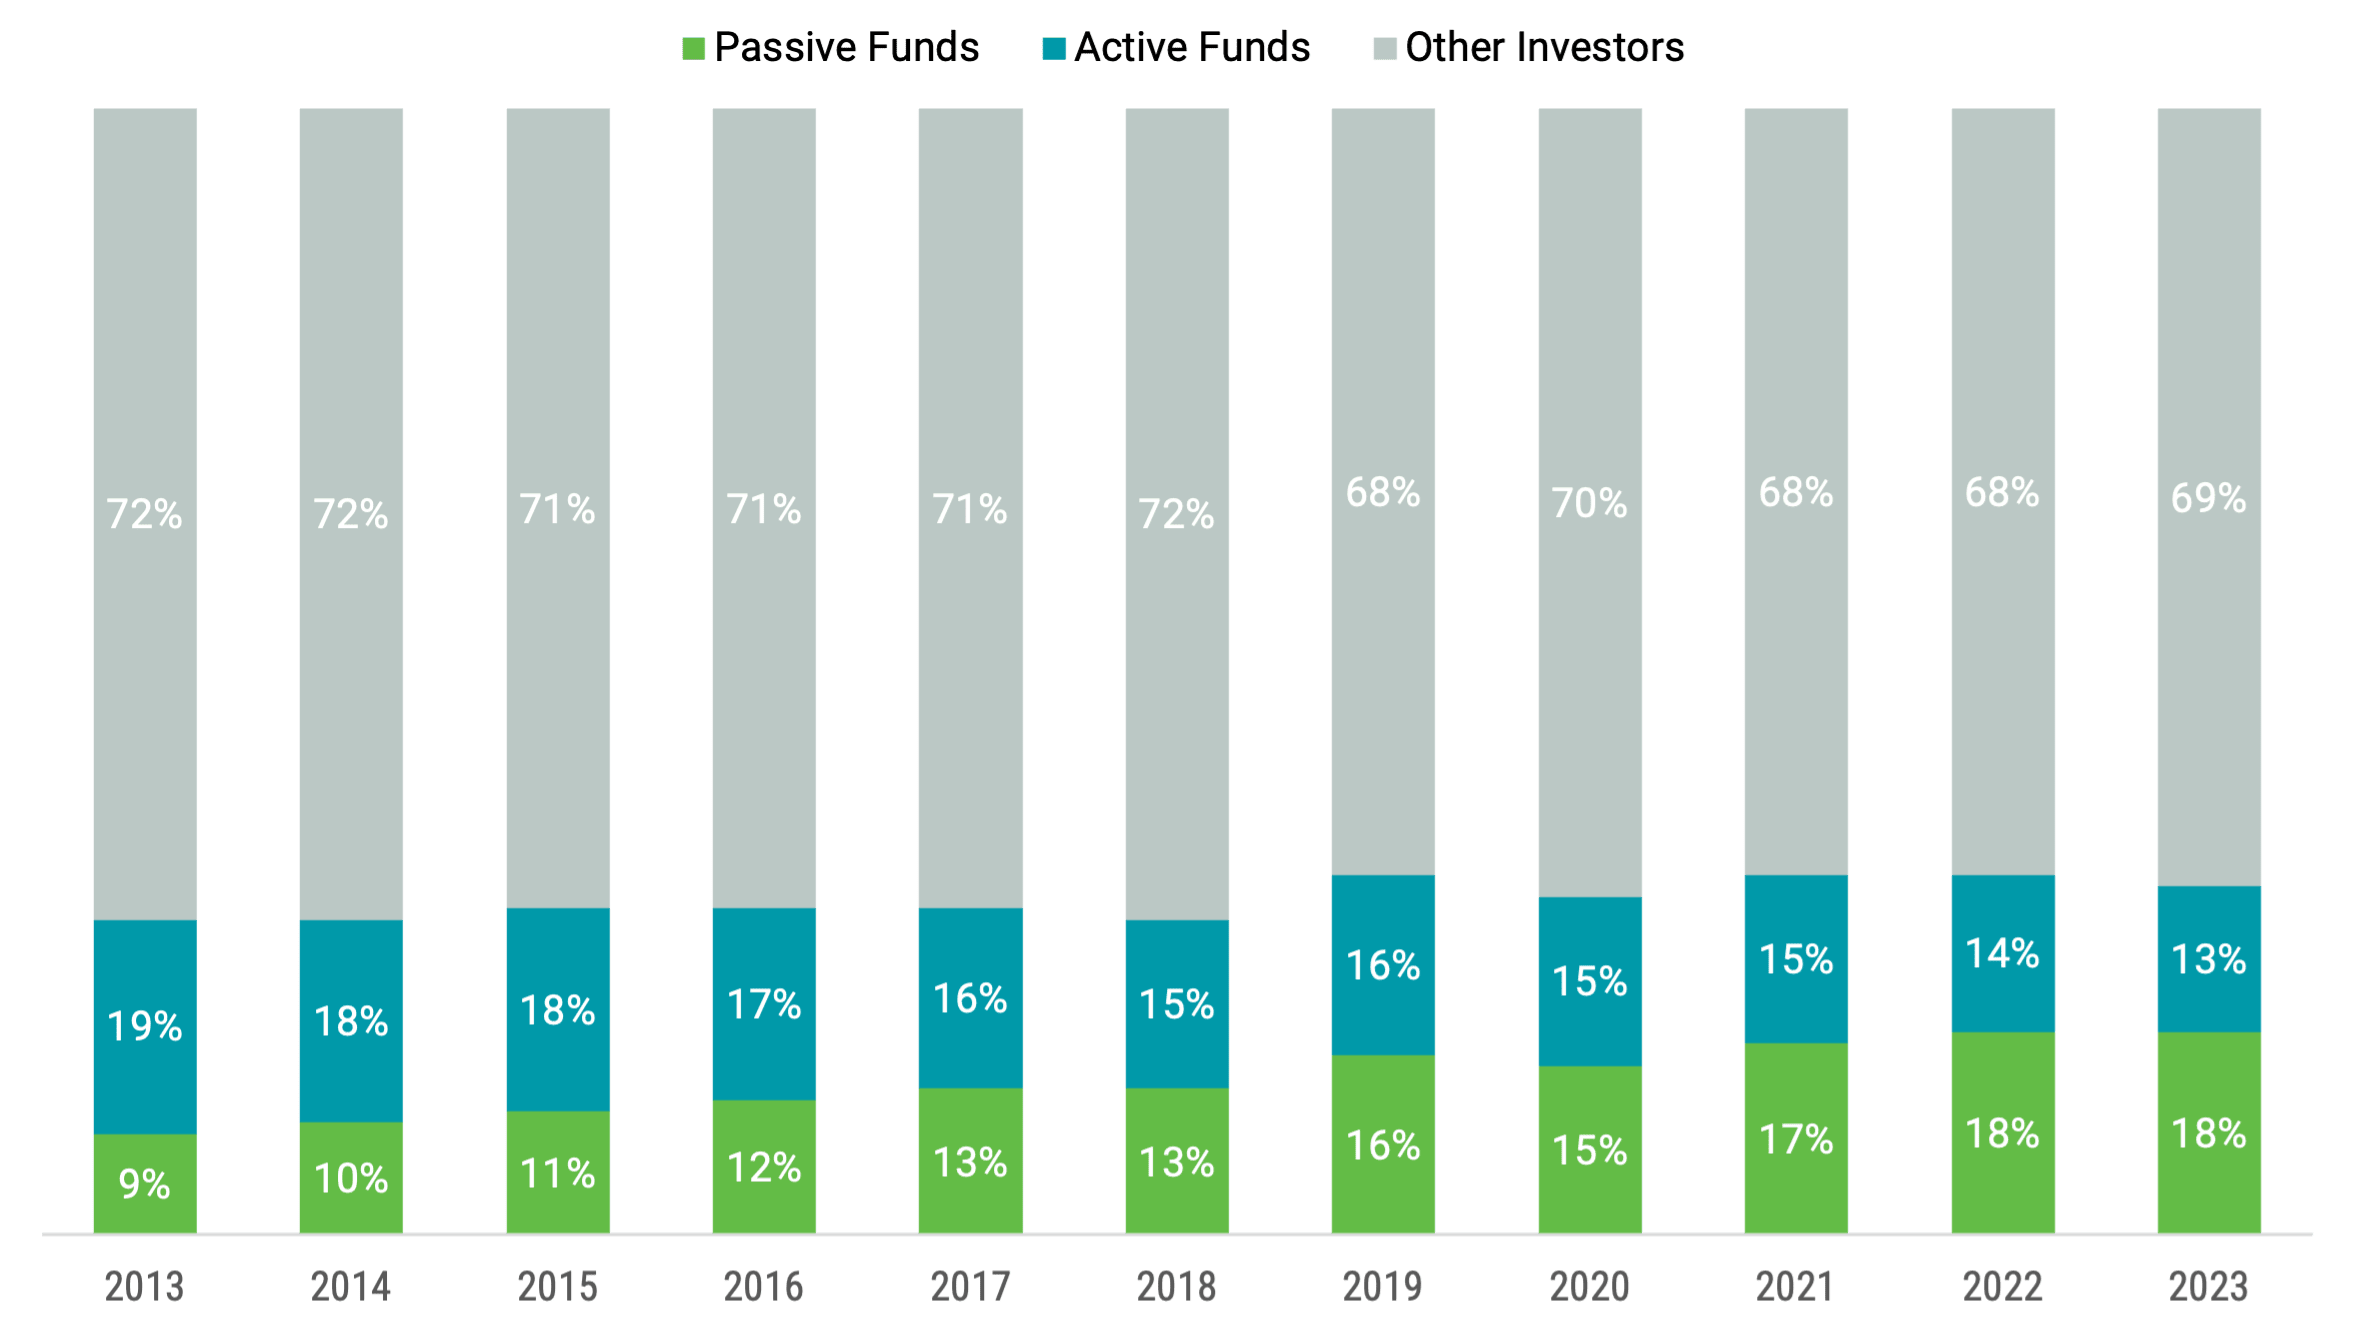
Data from 2013–2023. Source: Investment Company Institute (ICI), 2024 Fact Book.
We acknowledge that this still may not provide a complete picture of the ownership of companies attached to passive strategies, given that there may also be passive approaches managed in institutional and retail separate accounts. A recent study considered this reality and estimated the actual ownership of passive strategies between 30% and 35%.1 So, while it’s difficult to determine the total share of passive investing, we know it becomes much smaller when we expand our view beyond mutual funds and ETFs.
Redefining Passive Investing Strategies
The definition of passive investments also bears redefining. A truly passive investment makes no security selection decisions. For example, a total market index, such as the Russell 3000® Index, is designed to capture essentially all companies in the U.S. market at their market capitalization weight with very little security selection. This is a passive investment. While larger companies will have a higher dollar allocation than smaller companies, no companies are held disproportionally more or less than in the market.
In contrast, many other indexes tracked by funds today select subsets, or asset classes, of the market or even more customized indices that are even closer to traditional active stock picking. Think of the Russell 1000® Growth Index, representing U.S. large-cap growth stocks, or the Russell 2000® Value Index, representing U.S. small-cap value stocks.
With asset class indexes, someone — typically the index provider — makes security selection decisions about which companies to hold. These active decisions include which companies will be classified as large or small, value or growth and at what weight to hold them. Different index providers tend to make different choices when defining asset class indexes and when and how often to rebalance them. These aren’t truly passive investments.
The active decisions underlying asset class indexes can be viewed similarly to those made in traditional active stock-picking strategies, but portfolio managers don’t make these decisions. With funds tracking asset class or custom indices, portfolio managers are tasked with simply following the holdings selected by the index provider (e.g., FTSE Russell, S&P, CRSP, MSCI).
The Sharpe Ratio and Passive Investing
Following the logic of renowned economist and Nobel laureate Bill Sharpe, we can get an idea of the effects of truly passive strategies buying the market (i.e., those without security selection decisions). To start, the market is the aggregation of all company shares owned by all investors, as depicted in Figure 3.
Figure 3 | The Market Is the Aggregation of All Companies
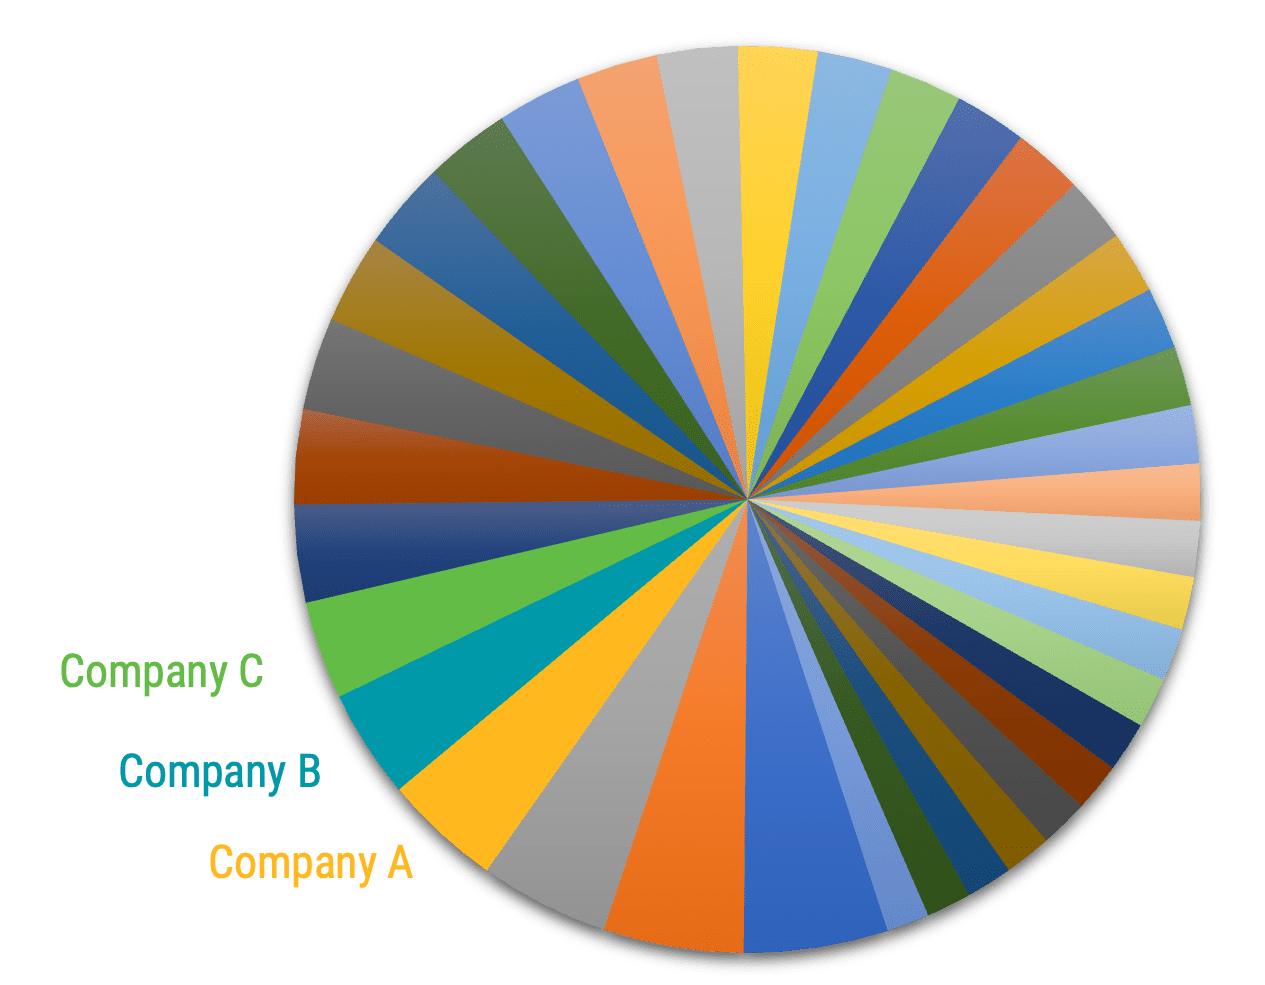
Source: Avantis Investors.
It follows that the market comprises all passive investors who hold a pro-rata slice of all companies in the market (market holders) and active investors with holdings that differ from the market (non-market holders). Non-market holders include active fund investors, asset class index fund investors and other investors who hold stocks outside of funds that don’t match the market.
Critically, Sharpe’s logic points out that if some investors buy the market, non-market holdings must also add up to the market in aggregate. Figure 4 illustrates this point.
Figure 4 | Market and Non-Market Investors Holdings Add Up to the Total Market
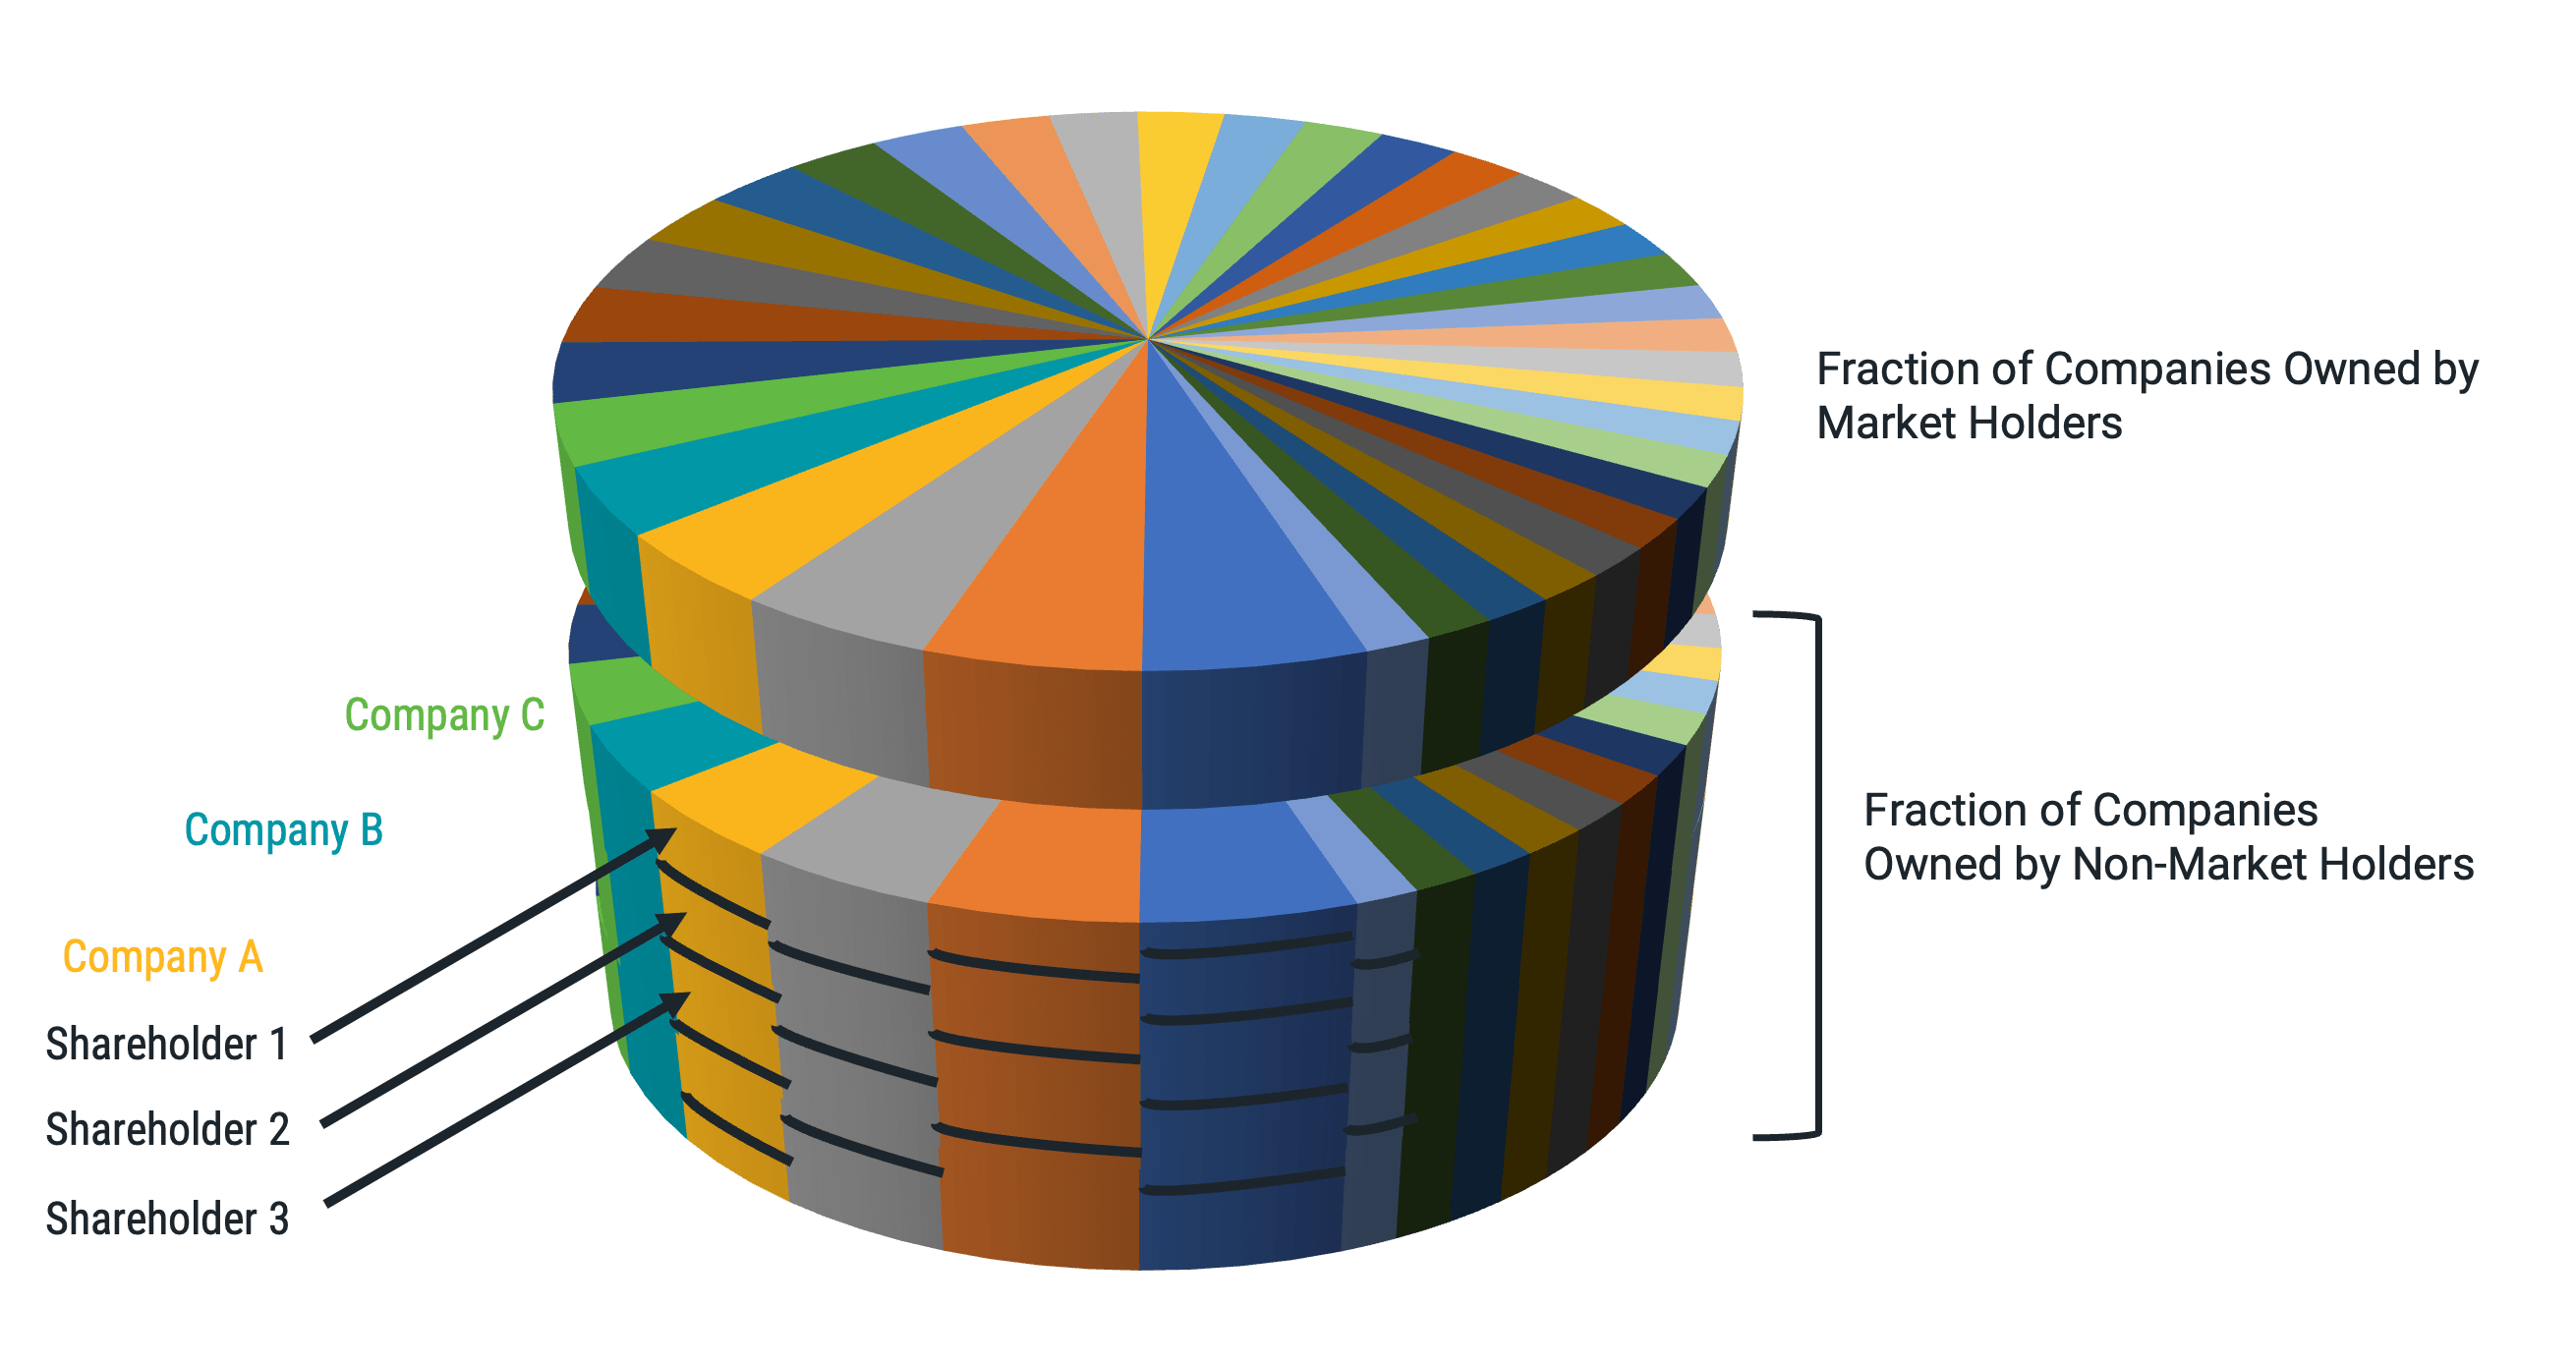
Source: Avantis Investors.
So, what happens when more investors become market holders (i.e., by buying total market index funds)? Let’s imagine that market holders own 30% of the market, and now, new investors have decided to move from cash to buy an additional 1% of the market. These new market holders need to buy an equivalent share of each company from a diversified group of non-market holders to increase the share for market holders.
In this scenario, the demand for the ownership fraction of each company is the same. While this activity may push prices (price incentivizes sellers), there is no clear reason why a small subset of companies (e.g., mega caps) will be bid up significantly more than the rest of the market. Figure 5 demonstrates this example.
Figure 5 | More Investors Buying the Market Portfolio Should Affect Prices of All Companies Equally
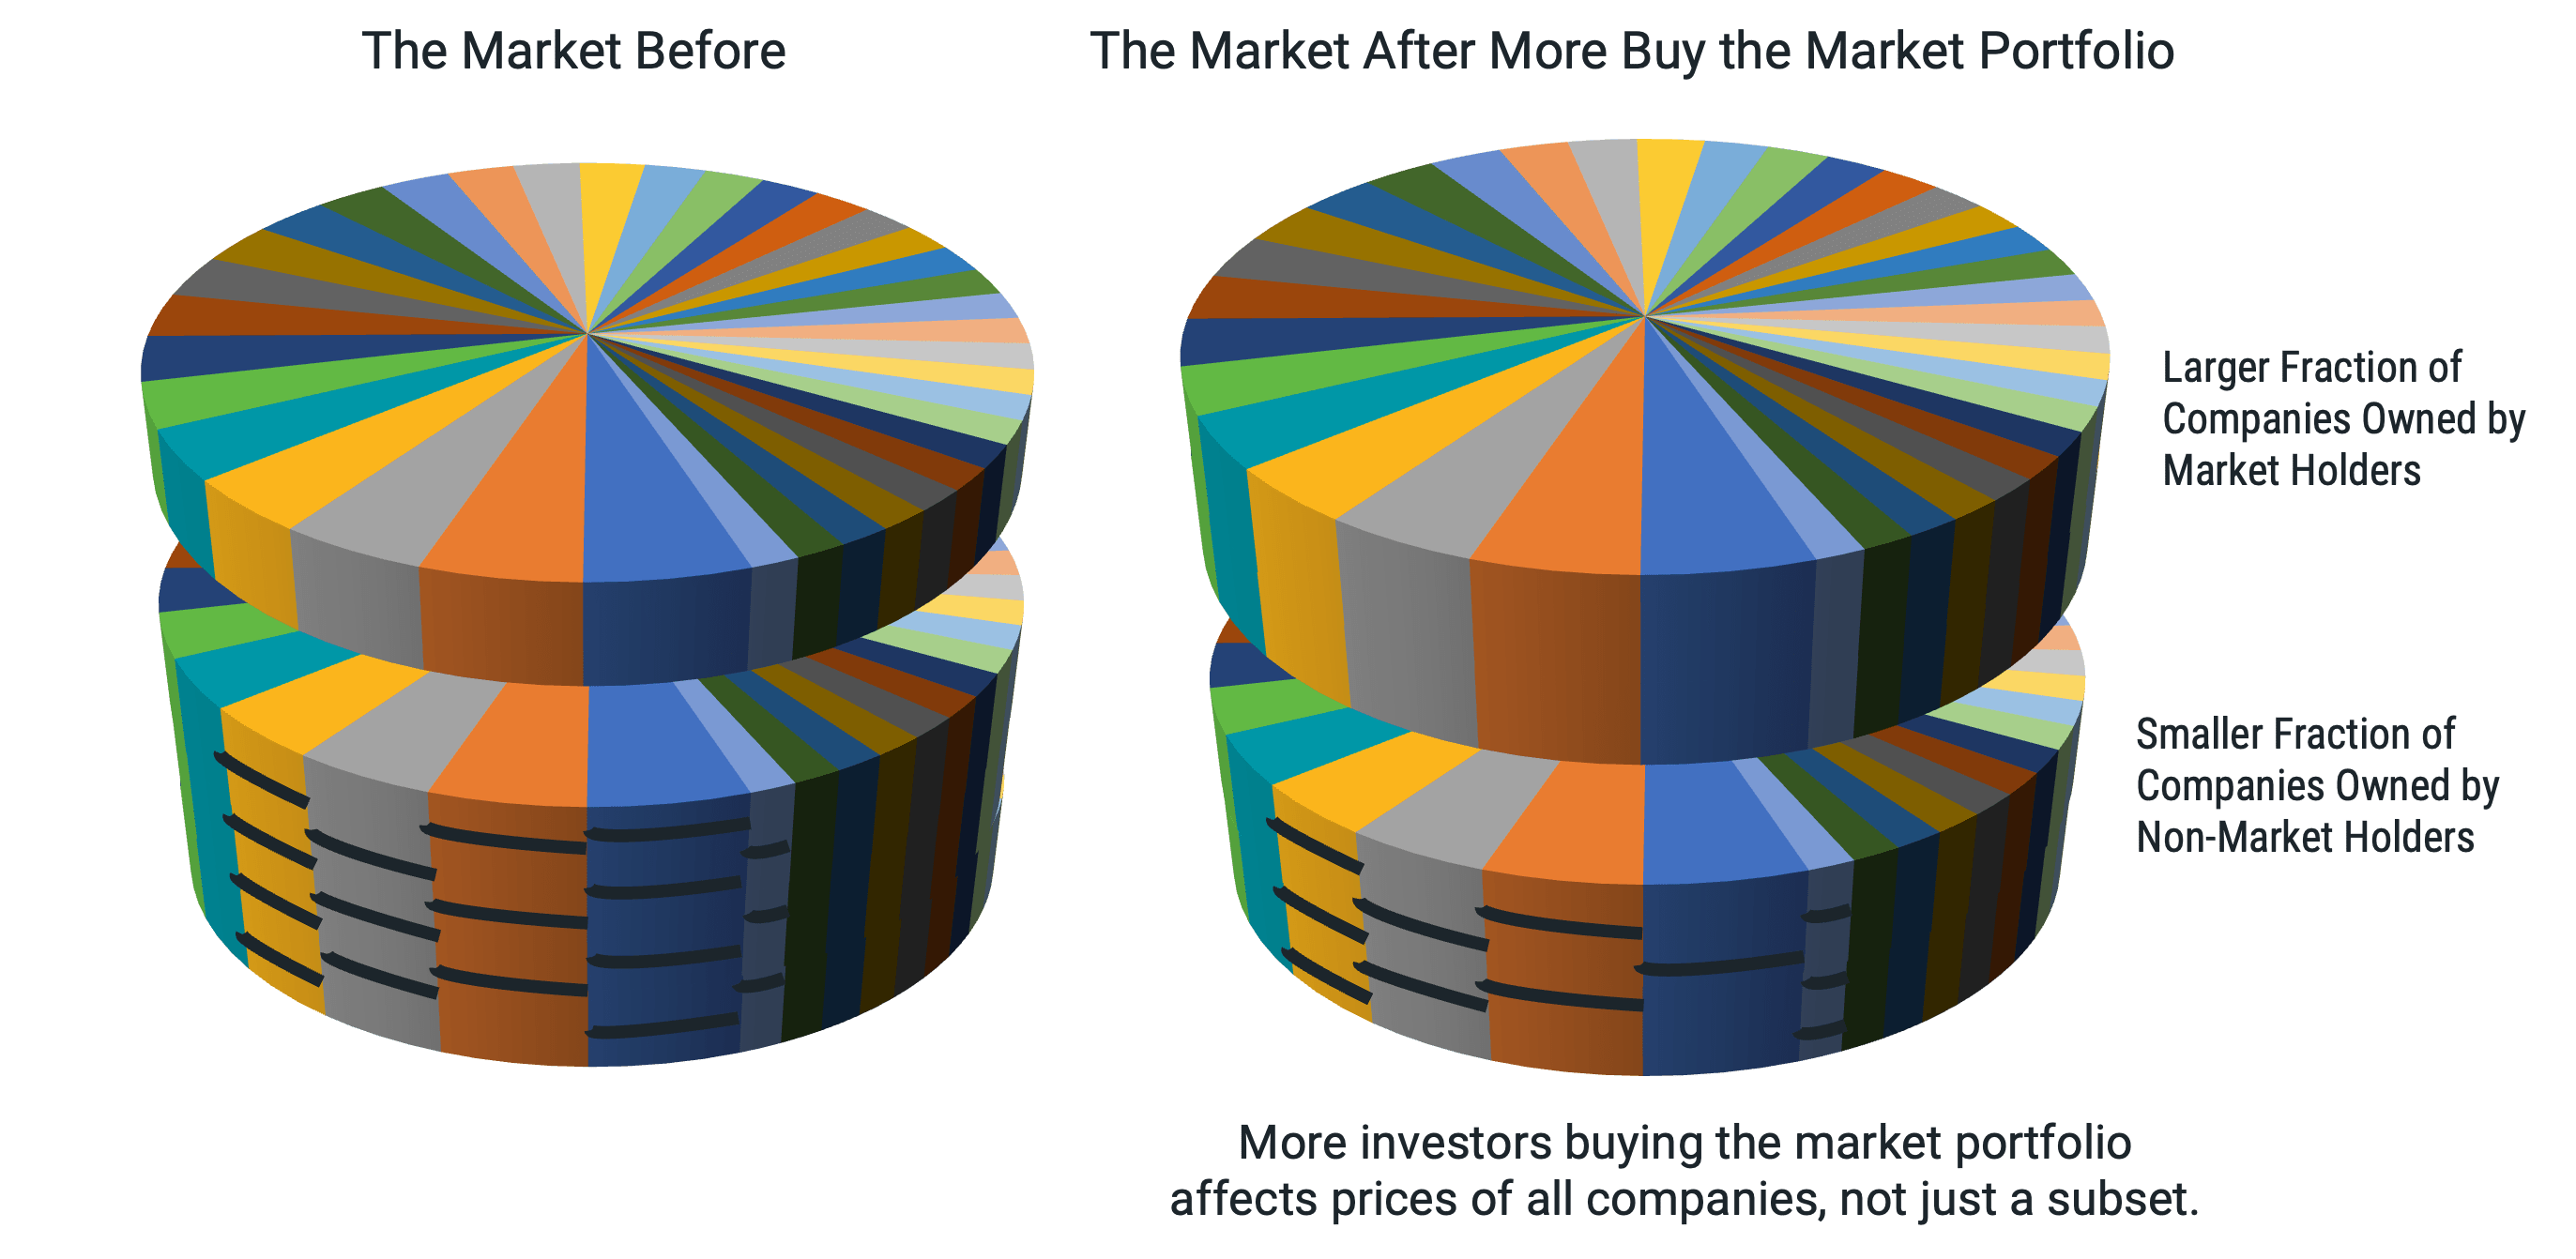
Source: Avantis Investors.
Who Drives Relative Price Changes?
In contrast to market holders, non-market investors are more likely to push the prices of some companies more than others. This is because non-market holders will prefer a subset of companies in the market and will buy them from other non-market investors who hold them. Again, the incentive for the seller is price. Market holders are only spectators to this activity and play no role in the trades.
This same effect can occur from non-market, asset class fund investors, whether from an actively managed fund, index-tracking fund or a strategy buying just a few stocks. If many investors come to prefer a particular asset class, those preferred securities can be pushed up in price more than other companies in the market. This is particularly true of funds tracking growth indexes that tend to continue to hold securities despite rising prices, whereas value indexes tend to sell securities as prices go up.
What About Non-Market Holders Converting to Market Holders?
In the scenario that many non-market holders decide to become market holders (i.e., rather than coming from cash, as in the first example), the distribution of the non-market holders matters when it comes to price effects. We can think of this as biased and non-biased cohorts of non-market holders.
Suppose the investors wishing to buy the market currently hold investments in aggregate similar to the market (non-biased cohort). In that case, the effect on prices should also be reasonably distributed across companies; in other words, there should be no significant difference in impact between companies.
If, instead, there is a bias to a particular area of the market among the non-market converters (biased cohort), such as holding only small-caps, then moving to the market portfolio would likely push down prices of small-cap stocks and push up prices of large-cap stocks. Importantly, that effect would not be limited to only the largest companies, such as the Magnificent 7 stocks. The effect would be across all large-cap companies.
Takeaways for Investors
In our view, this logic from Sharpe provides a powerful framework for understanding relative stock price movements from investor activity. While the details come with some complexity, we believe the critical takeaway is that there is a sound theory to address the common investor questions about the effects of continued growth among index funds.
The theory is clear that passive market holders shouldn’t have any significant effect on relative stock prices. It’s the non-market holders, including asset class investors (index or active) and, in particular, growth-oriented investors, who are more likely to push prices. This is just one reason we think all asset class strategies (index-based or otherwise) must be evaluated based on their methodology for selecting and weighing securities and overall expected implementation costs and results.
While some index-based strategies may look attractive based on expense ratios alone, when considering overall implementation costs, the low-cost advantage may be eliminated due to their prioritization of tracking the index on top of all other implementation costs.
The fact that market, or large-cap blend, index funds are allocating a large fraction of their assets to a few mega-cap companies with very high prices today, disregarding their expected returns or valuations, is caused by the high prices of these stocks. It’s not the reason why they have high prices. We think strategies that consider market capitalization and valuations should produce better outcomes for investors.
Explore More Insights
Alex Chinco (Baruch College, Zicklin School of Business) and Marco Sammon (Harvard Business School), “The Passive-Ownership Share Is Double What You Think It Is,” (April 2024). Available at SSRN.
Glossary
Exchange-Traded Fund (ETF): An ETF represents a basket of securities that trades on an exchange, similar to a stock. An ETF differs from a mutual fund in that its share price fluctuates all day as investors buy and sell the ETF. A mutual fund’s net asset value (NAV) is calculated once per day after the market closes.
Magnificent Seven: This phrase refers to seven stocks that have been high-performing in the technology sector — Alphabet, Amazon, Apple, Meta Platforms, Microsoft, NVIDIA and Tesla.
Market Capitalization: The market value of all the equity of a company's common and preferred shares. It is usually estimated by multiplying the stock price by the number of shares for each share class and summing the results.
Russell 1000® Growth Index: Measures the performance of those Russell 1000 Index companies (the 1,000 largest publicly traded U.S. companies, based on total market capitalization) with higher price-to-book ratios and higher forecasted growth values.
Russell 2000® Value Index: Measures the performance of those Russell 2000 Index companies (the 2,000 smallest of the 3,000 largest publicly traded U.S. companies, based on total market capitalization) with lower price-to-book ratios and lower forecasted growth values.
Russell 3000® Index: Measures the performance of the largest 3,000 U.S. companies representing approximately 98% of the investable U.S. equity market.
Sharpe Ratio: The Sharpe Ratio adjusts the returns of the portfolio for its risk by the volatility of returns. It is the ratio of the difference between the average return of the portfolio and the return of a Treasury bill to the standard deviation of the returns of the portfolio.
Investment return and principal value of security investments will fluctuate. The value at the time of redemption may be more or less than the original cost. Past performance is no guarantee of future results.
This material has been prepared for educational purposes only. It is not intended to provide, and should not be relied upon for, investment, accounting, legal or tax advice.
The opinions expressed are those of the portfolio team and are no guarantee of the future performance of any Avantis fund.
References to specific securities are for illustrative purposes only and are not intended as recommendations to purchase or sell securities. Opinions and estimates offered constitute our judgment and, along with other portfolio data, are subject to change without notice.
©2026 Morningstar, Inc. All Rights Reserved. Certain information contained herein: (1) is proprietary to Morningstar and/or its content providers; (2) may not be copied or distributed; and (3) is not warranted to be accurate, complete or timely. Neither Morningstar nor its content providers are responsible for any damages or losses arising from any use of this information.