
Currency Effects on Non-U.S. Stock Returns
It’s no secret that over the last 10 years, non-U.S. stock returns have trailed U.S. stocks. However, you might not know that, from the perspective of U.S. investors, non-U.S. market returns over this period have been meaningfully affected by something other than the stocks themselves — currency.
When U.S. investors buy foreign stocks, they become exposed to two sources of return. First, they receive the return of the underlying stocks in their local currencies. Second, the total return of the investment reflects changes in the exchange rates between the U.S. dollar (USD) and the local currencies held.
Simply put, a weakening dollar will contribute to USD-based returns (i.e., you can get more dollars for a unit of foreign currency than before). In contrast, a strengthening dollar detracts (i.e., you can get fewer dollars than before). A strengthening dollar is precisely what we’ve experienced over the last decade.
We see this clearly in Figure 1, which illustrates the change in the USD versus a basket of major international currencies. Since 2014, the dollar has appreciated just over 30%.
Figure 1 | The Dollar Has Appreciated 30% vs. Major International Currencies Since 2014
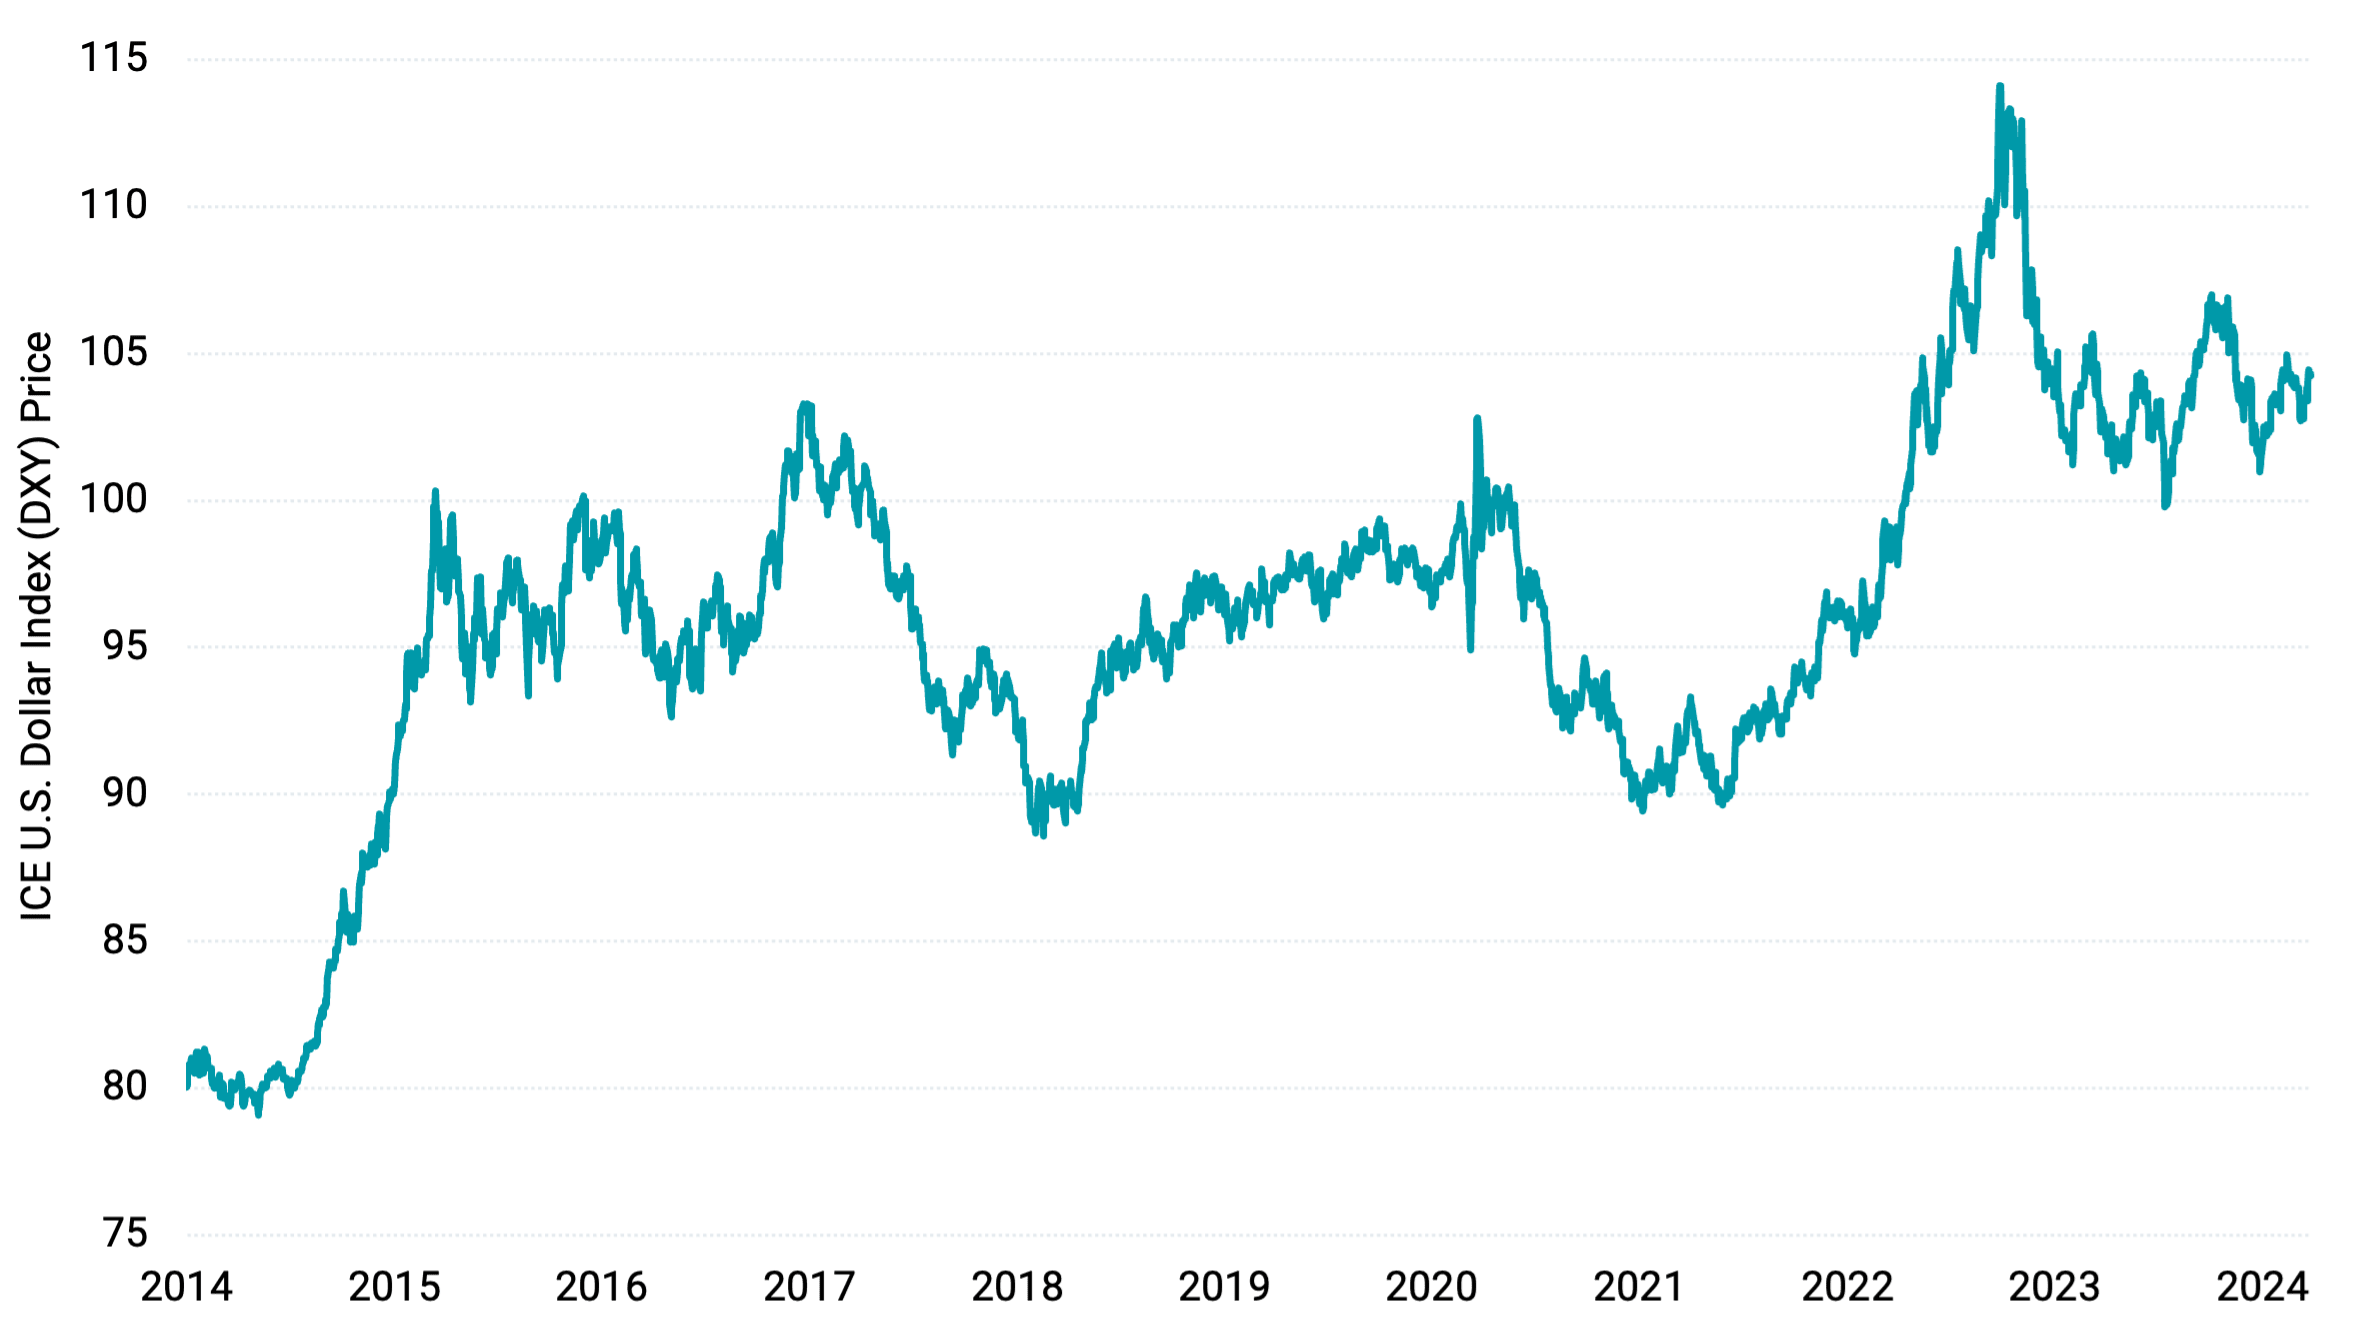
Data from 1/1/2014 - 3/26/2024. Source: Bloomberg. The ICE U.S. Dollar Index (DXY) compares U.S. dollars to a basket of non-U.S. currencies. It currently includes euros, Japanese yen, British pounds, Canadian dollars, Swedish krona and Swiss francs. Past performance is no guarantee of future results.
Figure 2 shows a more granular view, including 10 of the most highly traded foreign currencies and, for each, the relative annual percentage change in terms of USD since 2000. Darker shades of green indicate periods when USD depreciated at higher levels versus a given foreign currency and darker shades of red when USD appreciated at higher levels.
Figure 2 | Change in Price of $1 USD in Different Currencies (%)
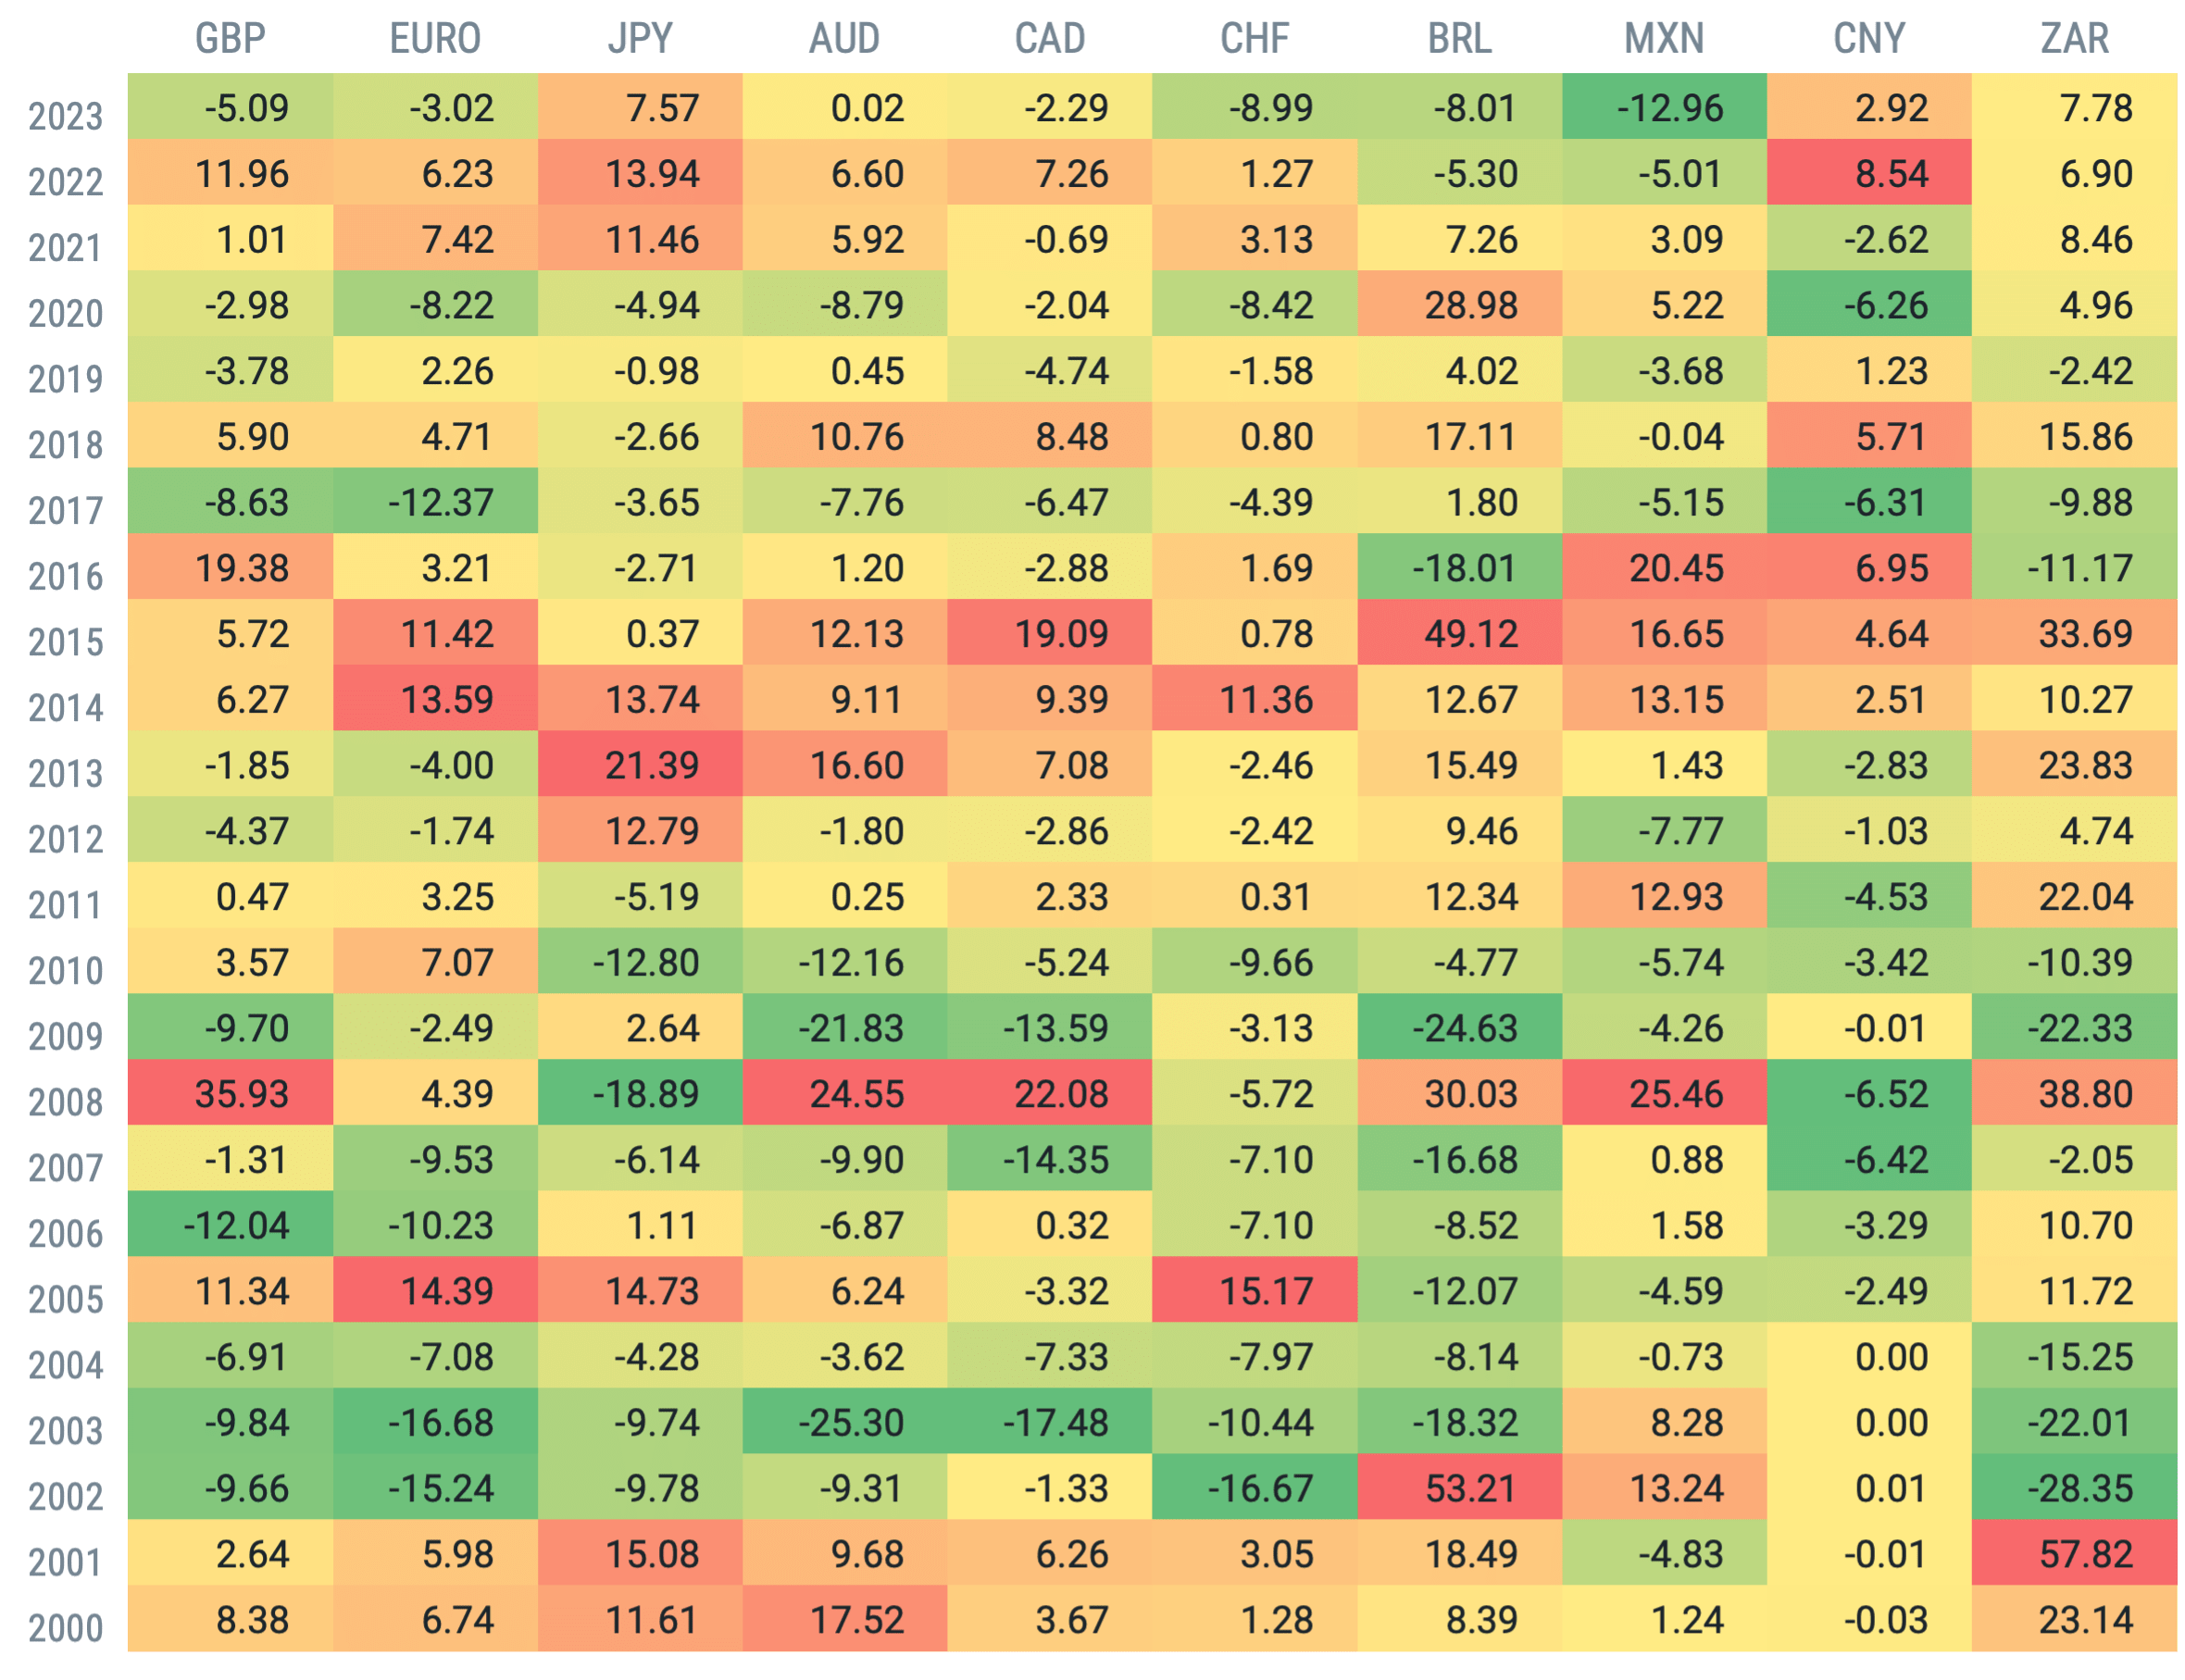
Data from 1/1/2000 - 12/31/2023. Source: Bloomberg. GBP = British pound sterling. JPY = Japanese yen. AUD = Australian dollar. CAD = Canadian dollar. CHF = Swiss franc. BRL = Brazilian real. MXN = Mexican peso. CNY = Chinese yuan. ZAR = South African rand. Past performance is no guarantee of future results.
It’s easy to see that the dollar hasn’t experienced straight-line appreciation year over year versus all major foreign currencies. There’s a great deal of variance in a given year from currency to currency and year to year for a single currency. Yet, zooming out, we generally see more red, yellow and orange (higher levels of USD appreciation) in the last 10 years compared to more dark and light green (higher levels of USD depreciation) in the earlier years of the century.
Over the last decade, the result has been a wide margin between the returns of non-U.S. stocks in their local currencies versus USD. Figure 3 presents this data for stocks in non-U.S. developed and emerging markets. The chart shows cumulative returns since 2014, over which time non-U.S. developed returns in USD (64.00%) were just over half of the local return (110.59%), and emerging markets returns in USD (34.88%) were less than half of the local return (75.06%).
Figure 3 | Non-U.S. Stock Returns Since 2014 Have Been Far Higher in Local Currencies vs. USD
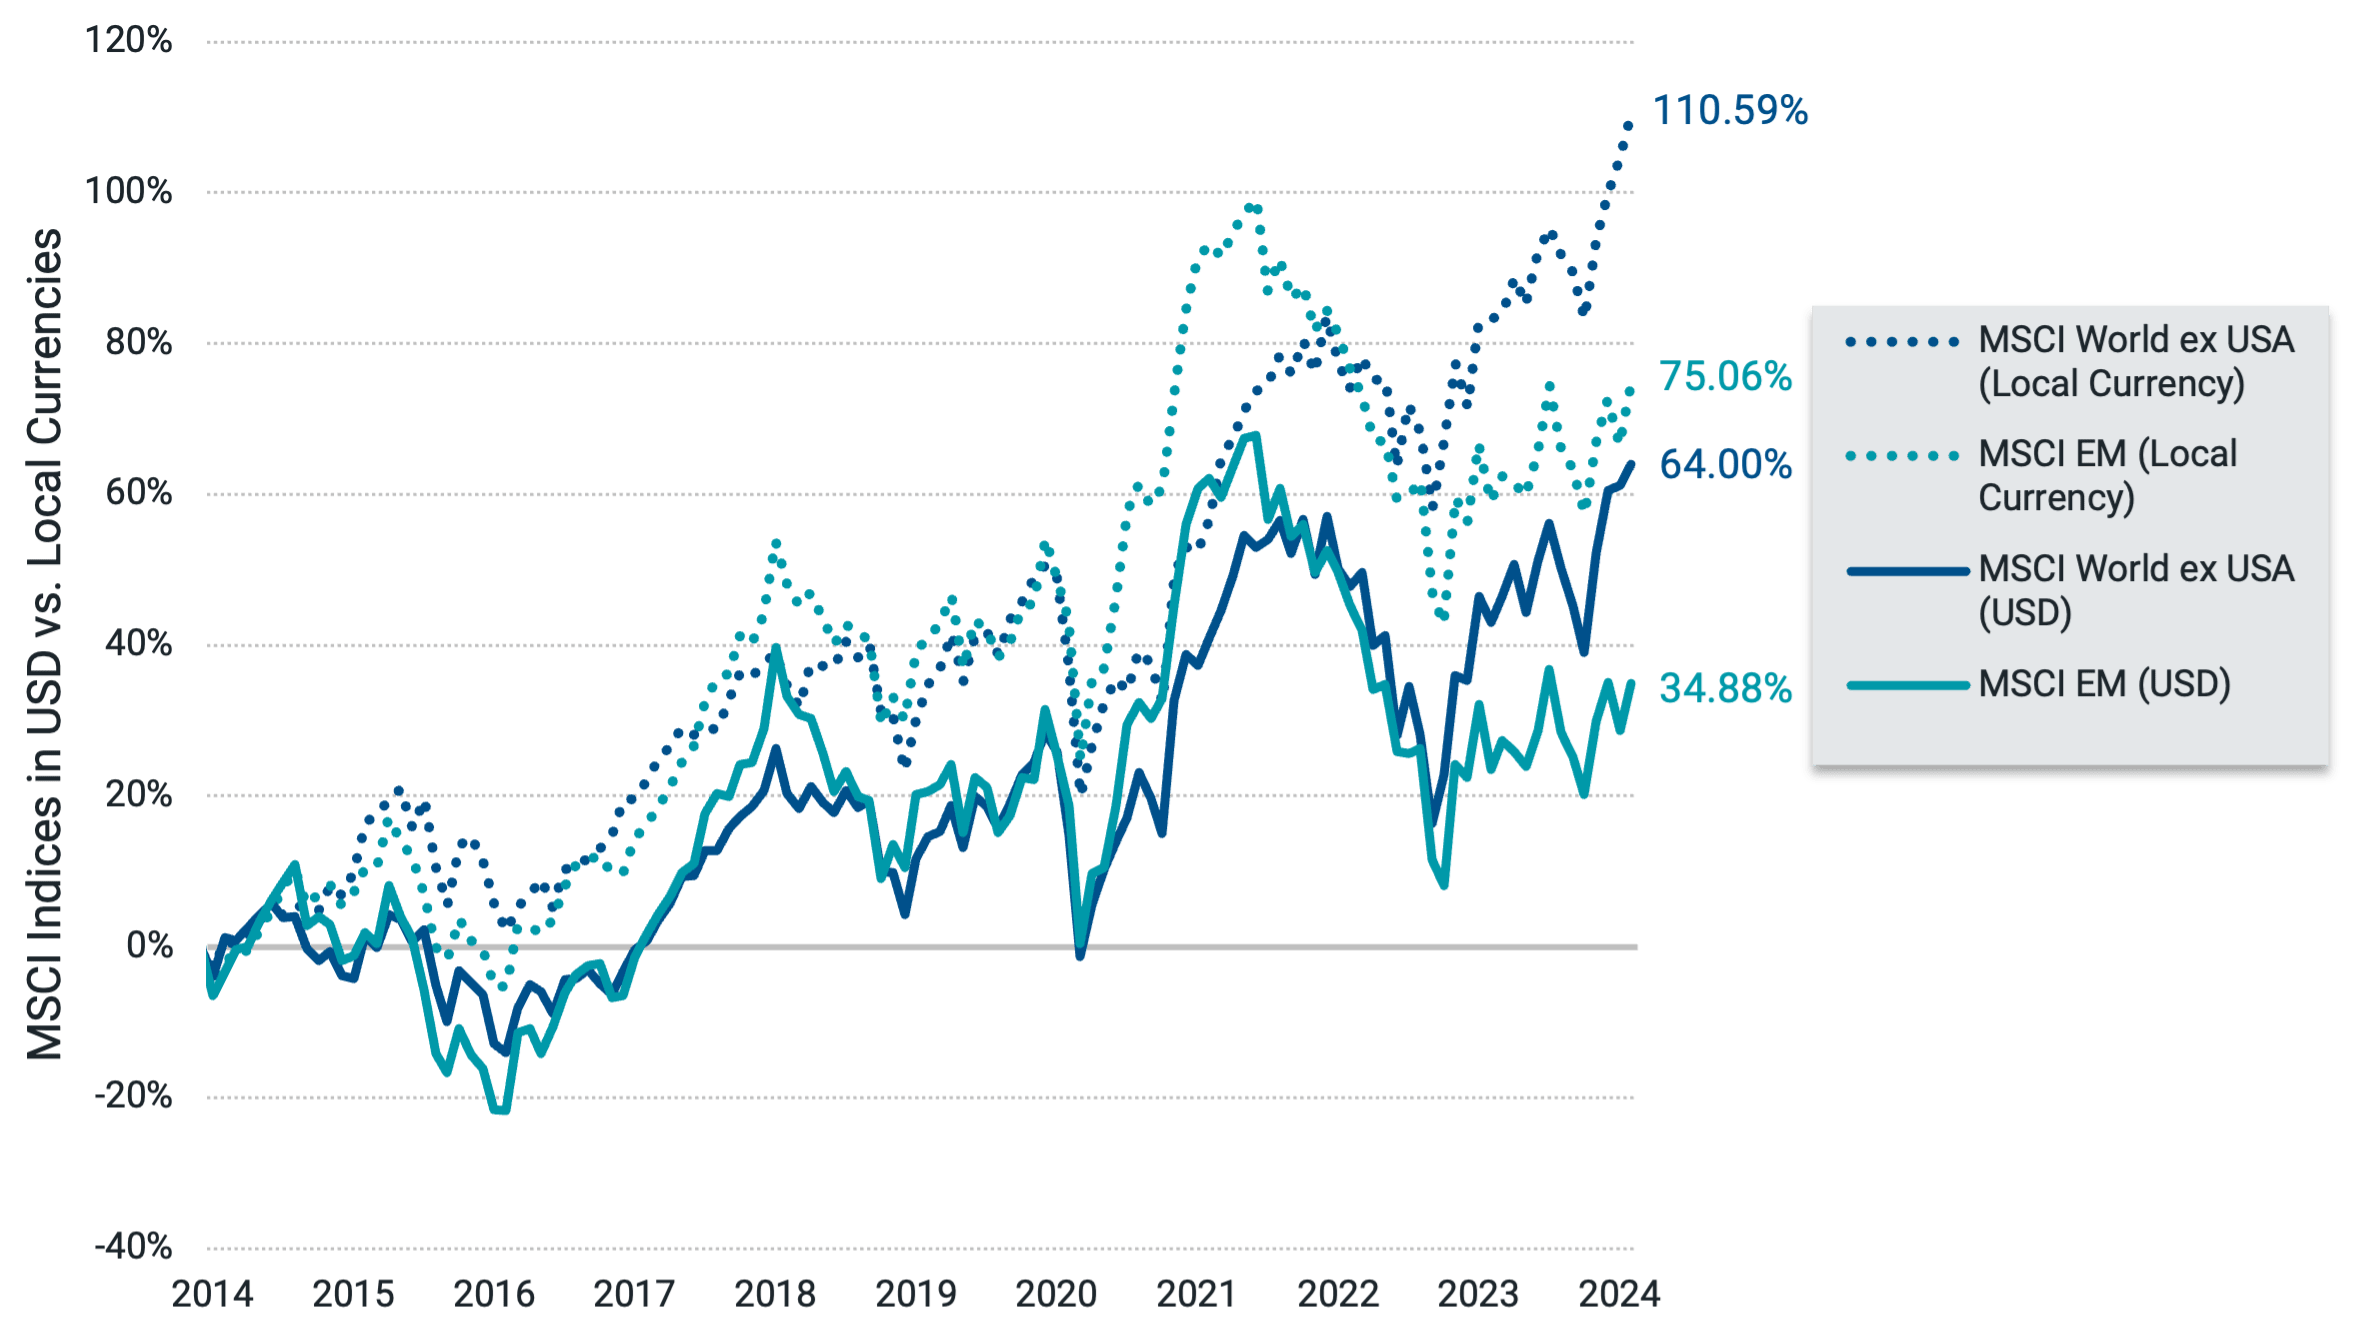
Data from 1/1/2014 - 2/29/2024. Source: Bloomberg. Non-U.S. developed represented by the MSCI World ex USA Index (USD and local currency) and emerging markets by the MSCI Emerging Markets Index (USD and local currency). Past performance is no guarantee of future results.
While in the aggregate, currency effects have been a drag over this period, if we take a longer-term view, we find there have historically been many periods when it hurt returns but also many when it helped. Figure 4 provides evidence of this, isolating the currency effect by calculating the difference between three-year annualized returns in USD and local currency and presenting it on a rolling basis.
Figure 4 | Currency Effect Hurts Returns Over Some Periods But Helps Over Others
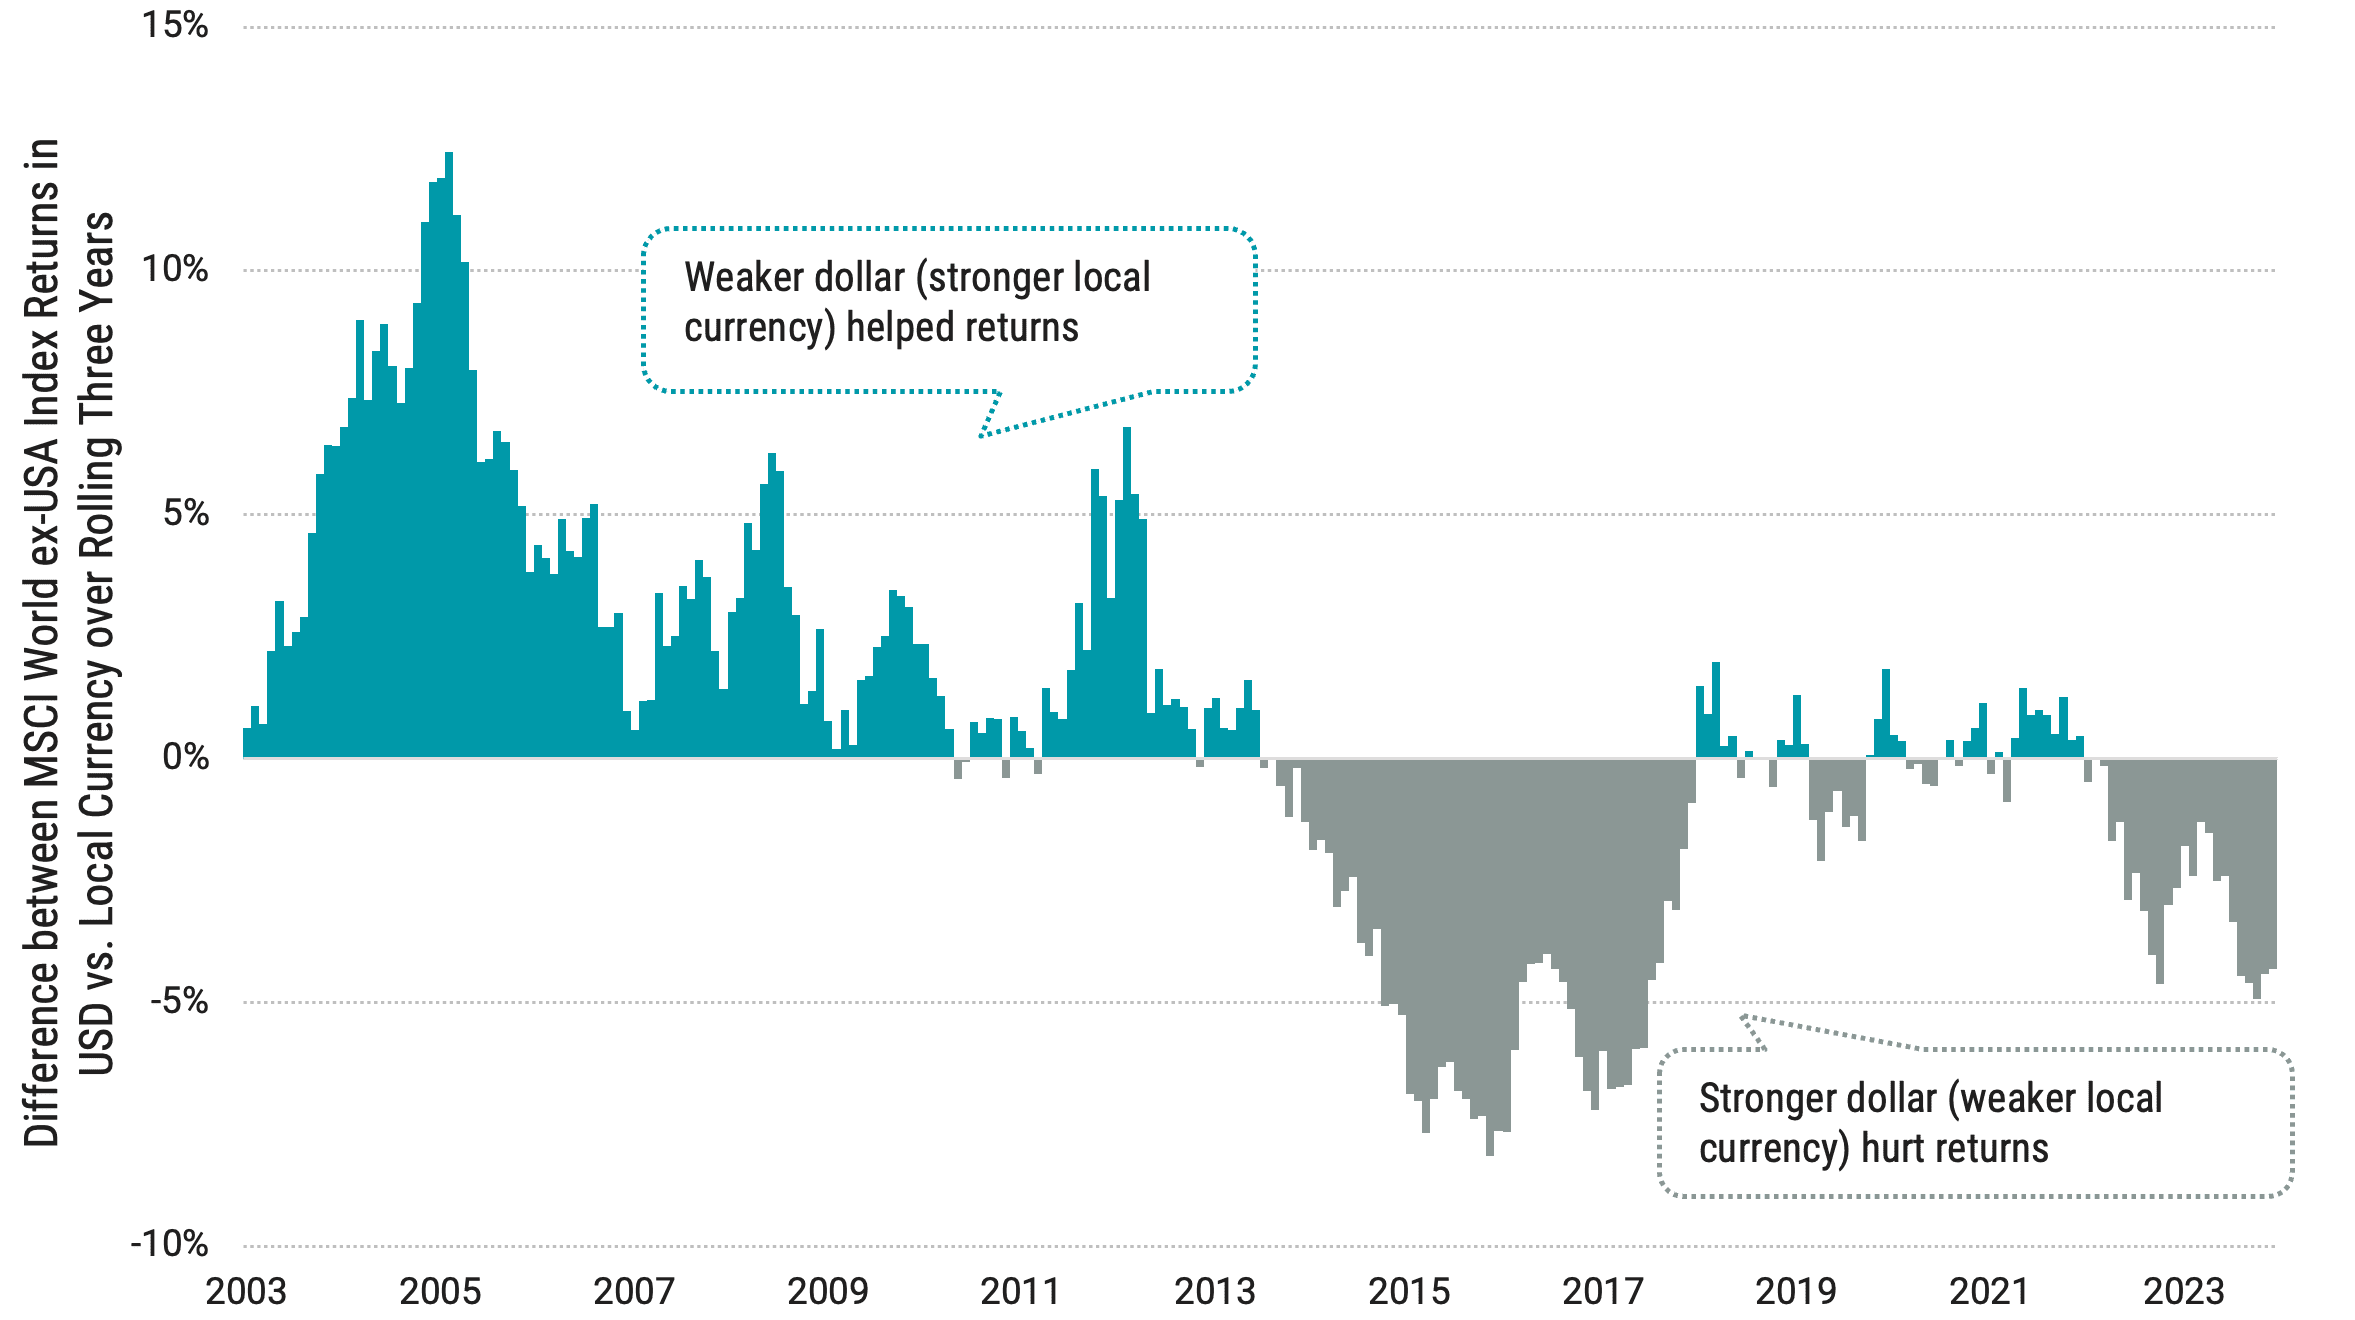
Data from 1/2000 - 12/2023. Source: Bloomberg. Rolling 3-year returns means that we are calculating investment performance over consecutive, overlapping periods of three years each, where each period starts one month after the previous period. For example, 1/31/2000 - 1/31/2003; 2/28/2000 - 2/28/2003; 3/31/2000 - 3/31/2003, and so on. We show 252 rolling periods in the chart above. Past performance is no guarantee of future results.
It’s clear that currencies move a lot, and exchange rates can have sizable swings over time. Even when we see extended periods when the currency effect is positive or negative, the magnitude can shift quite a bit from period to period. Currencies are volatile, and their movement is unpredictable, just like future stock returns are unpredictable. This serves as a reminder that we shouldn’t expect what’s happened lately to continue forever, but we shouldn’t be surprised if it does continue for some time.
One possible reaction to the data may be to wonder, “Should I hedge my non-U.S. stock portfolio?” There are a few things to consider. First, a USD-hedged non-U.S. stock strategy effectively buys the stocks in local currency and adds a bet on USD versus other currencies. Since currency movements are unpredictable, this is like making a random bet. Sometimes, the hedge will help returns and other times, it will hurt.
A USD hedge would have helped over the last decade, as the dollar has gotten stronger, but the hedge would have detracted from returns over the decade before. Second, unlike with bonds, the higher volatility of equities when compared with currencies means that the total volatility of a global equity portfolio, whether hedged or unhedged, is expected to be similar over the long term. For context, Figure 5 charts the growth of a dollar for global stocks on a hedged and unhedged basis since 2001.
Figure 5 | Global Stocks Have Historically Had Similar Long-Term Returns Whether Hedged or Unhedged
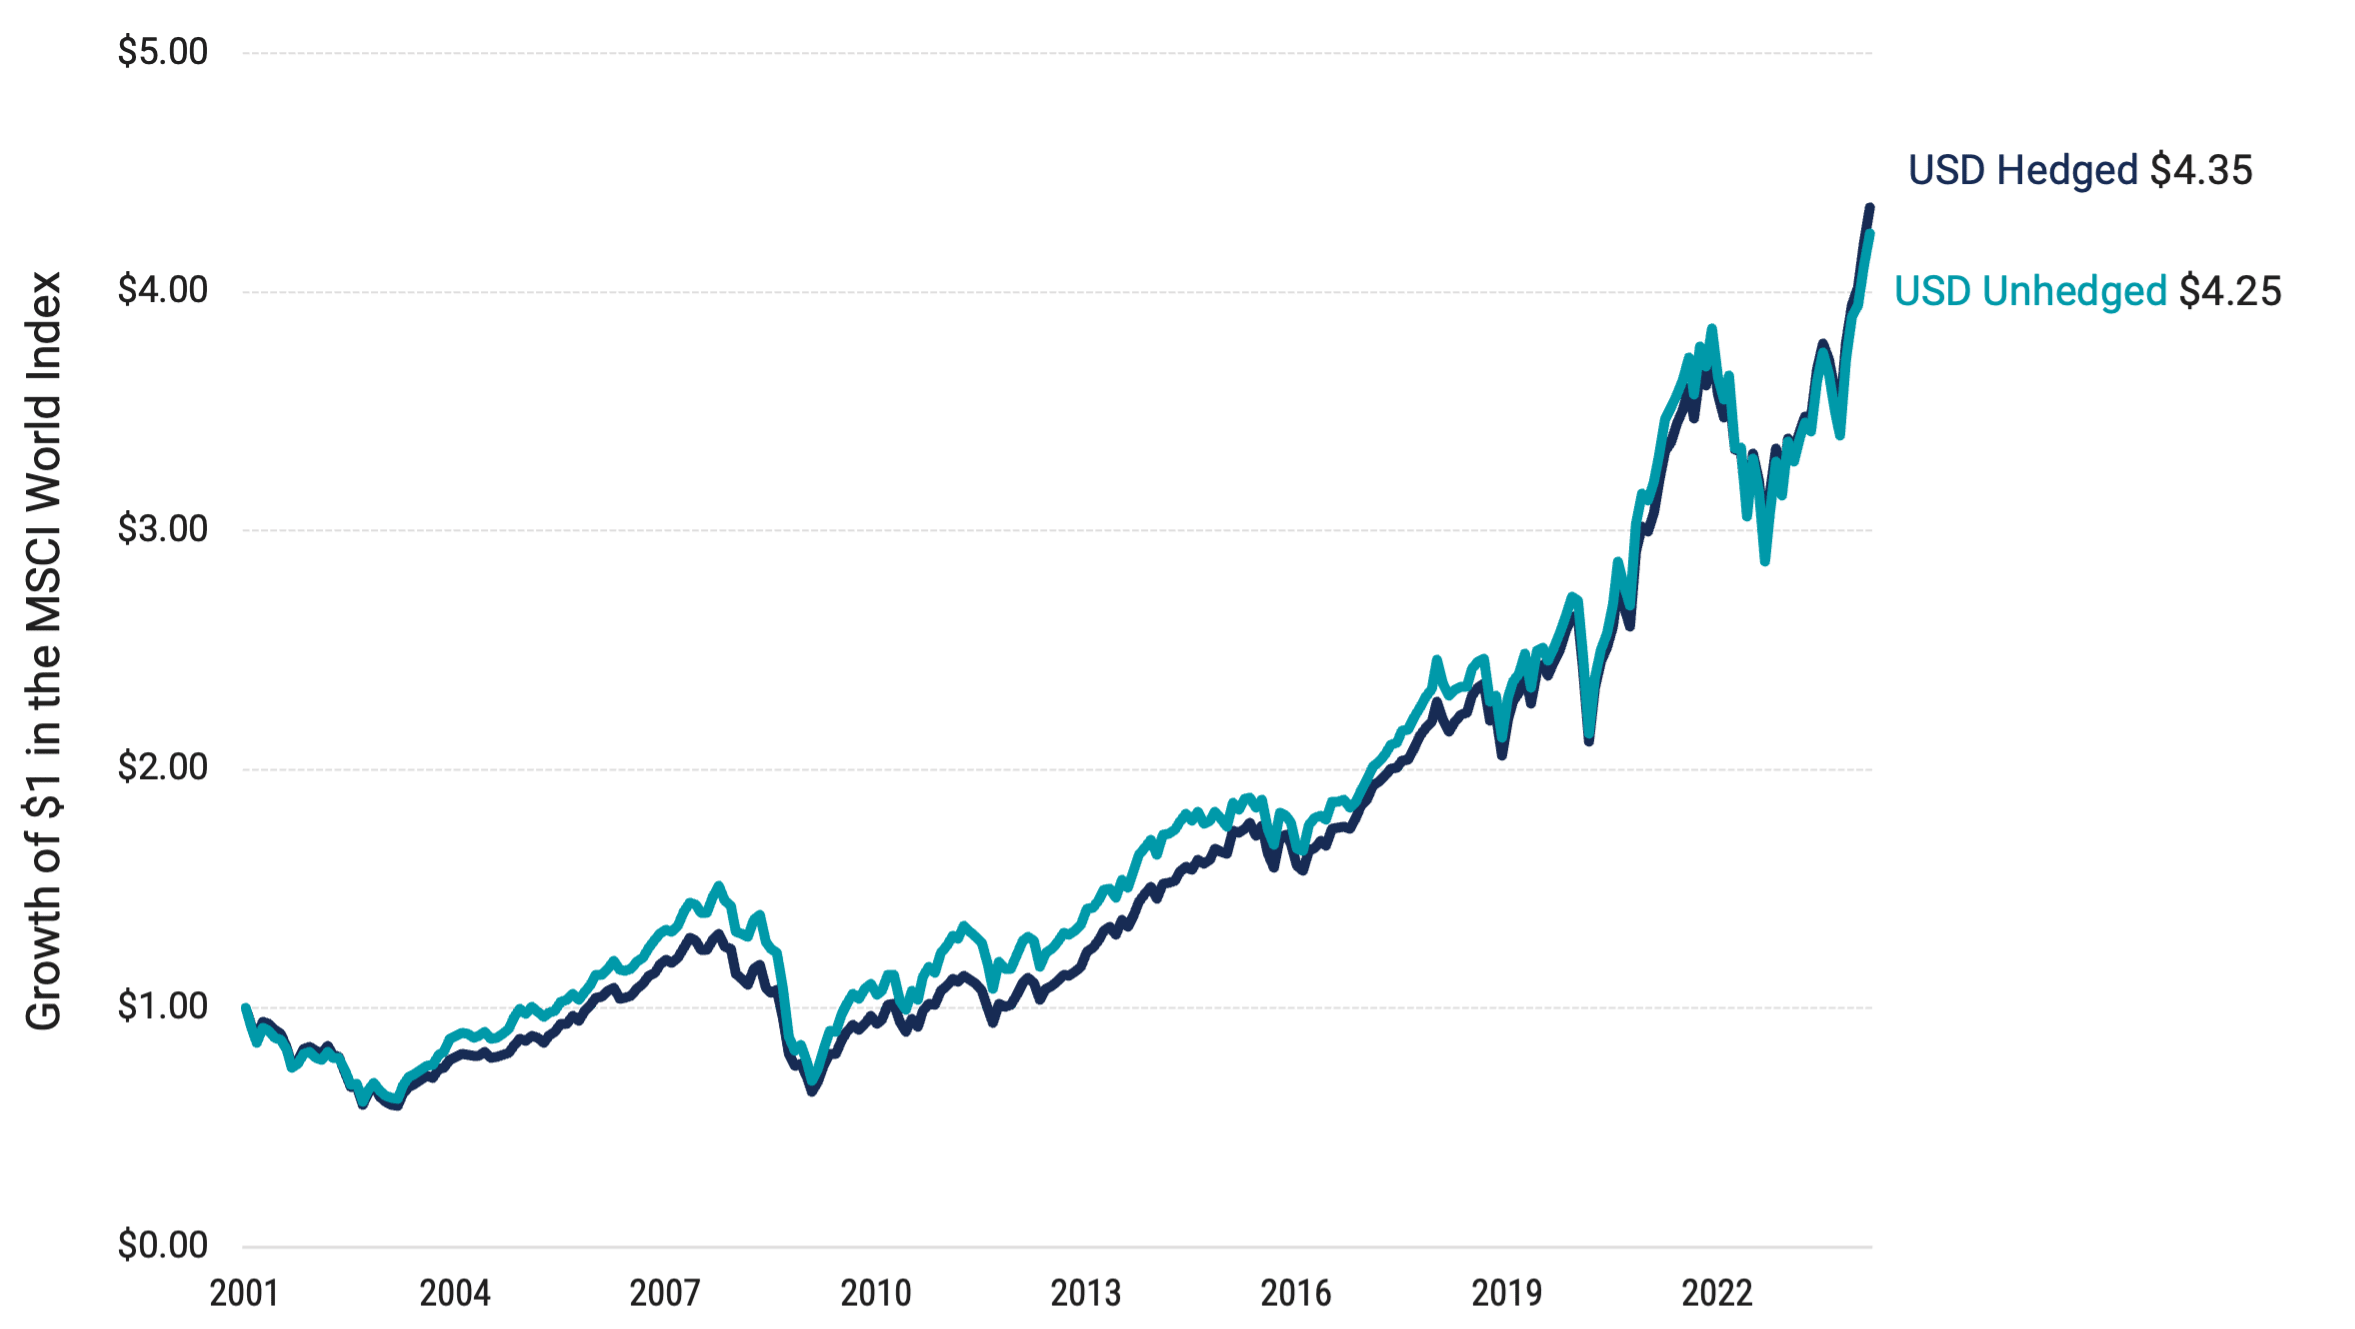
Data from 1/1/2001 - 3/29/2024. Source: Bloomberg. Past performance is no guarantee of future results.
Finally, we can’t ignore the fact that hedging is not free. Paying for a random bet on a currency (or putting all of one’s eggs in the USD basket) may not sound like a great idea for most investors.
Thinking about the bigger picture, we believe what’s important for investors to bear in mind is that we should be careful not to infer that past performance can predict what will happen next. That’s true of currencies and stock returns. Suppose we let an extended period of a strengthening dollar and underperformance from non-U.S. stocks lead us to avoid international stocks. In that case, we may make the wrong decision and miss out on better times ahead.
The point of global diversification is that total portfolio returns rely less on any single investment, region or currency. Regardless of which outperforms over a period, you’ll always have returns that are not the best but, importantly, not the worst. Unlike future exchange rates or future stock returns, that’s something we can know with certainty today and “good” returns compounded over the long term can make a big difference.
Glossary
ICE U.S. Dollar Index (DXY): Compares U.S. dollars to a basket of non-U.S. currencies. It currently includes euros, Japanese yen, British pounds, Canadian dollars, Swedish krona and Swiss francs.
MSCI Emerging Markets Index: A free float-adjusted market capitalization index that is designed to measure equity market performance of emerging markets.
MSCI World ex USA Index: Designed to measure large- and mid-cap companies across 22 developed markets outside the U.S. It is not an investment product available for purchase.
MSCI World Index: A free float-adjusted market capitalization weighted index that is designed to measure the equity market performance of developed markets.
Investment return and principal value of security investments will fluctuate. The value at the time of redemption may be more or less than the original cost. Past performance is no guarantee of future results.
This material has been prepared for educational purposes only. It is not intended to provide, and should not be relied upon for, investment, accounting, legal or tax advice.
The opinions expressed are those of the portfolio team and are no guarantee of the future performance of any Avantis fund.