The Certain Uncertainty of Short-Run Economic Predictions
Bloomberg published an article near the end of December last year reporting outcomes from its latest monthly economic survey.1 Survey respondents included 38 economists who each offered a forecast for 2023.
Like many at the time, the survey results were generally pessimistic about the economy.
The survey’s median estimated growth rate for U.S. gross domestic product (GDP) over 2023 was just 0.3%. This included a projected decline of 0.7% in the second quarter and flat growth in the first and third quarters.
Respondents projected inflation would reduce modestly over the year, and the chances of a recession in 2023 were pegged at 70%.
Today, we know these forecasts turned out to be far from reality.
Actual GDP growth in 2023 has come in at 2.0%, 2.1% and 4.9% for quarters one through three, respectively.2
The year-over-year change in the Consumer Price Index (CPI) stands at 3.7%, down from 6.5% in December.3
The Federal Reserve’s (Fed's) preferred measure, core personal consumption expenditures (PCE) inflation, fell to 2.4% in the third quarter from 3.7% in the second quarter — the lowest since the end of 2020.4
And the unemployment rate remains low at 3.8% as of September.5
In many ways, the data points to the U.S. economy being in a pretty good state rather than on the verge of a recession.
The differences between the forecasts and realized results are striking. Still, our point is neither singling out one economic survey (many others offered similar forecasts) nor saying the economy is now freely out of the woods (risks remain). Instead, our view is that economic predictions come with great uncertainty.
Investors should know that making wholesale changes to asset allocations based on these types of forecasts can prove costly. In this article, we present research that highlights these points and helps to explain 1) why short-term economic forecasts from the start of 2023 might have been so off the mark and 2) why the long-term prospects for markets and the economy remain positive.
Does Economic Growth Require Low Interest Rates?
A central tenet to many predictions of slowing economic growth and an impending recession is that rising interest rates would weigh on businesses and consumers. The Fed began raising rates in March 2022 and has taken the federal funds rate from effectively zero to north of 5%.
While it’s clear that higher rates should have some effect, a relevant question for predicting economic growth in the future is whether growth requires low interest rates or if growth is precluded at today’s higher rates. We present findings from our analysis in Figure 1.
We start with a reminder in Panel A that while rates are higher today than in past years, today’s levels aren’t outside the norm if considered within a historical context. After living through more than a decade where rates were most often near zero, it may be easy to forget that the economy has gone through many periods of similar or even higher rates than we see today.
Panel B plots historical rates at the end of each quarter going back to 1947 versus the subsequent one-year GDP growth rate. The results are similar, whether using the federal funds rate or the three-month Treasury bill (T-bill) rate. We observe that the relation is quite noisy with no clear pattern.
There have been periods of strong, positive GDP growth when rates were lower as well as when rates were higher. At the same time, there have been periods of lower, or even negative, GDP growth when rates were higher and, in some cases, when rates were low or near zero!
We already know from what we’ve seen in 2023 that GDP growth doesn’t require near-zero interest rates, and higher rates don’t guarantee that future economic growth will suffer. The historical evidence shows us that current rate levels offer little information about future economic growth.
Figure 1 | Historically, Economic Growth Has Occurred During Periods of Higher and Lower Rates
Panel A | Rate Levels Throughout History
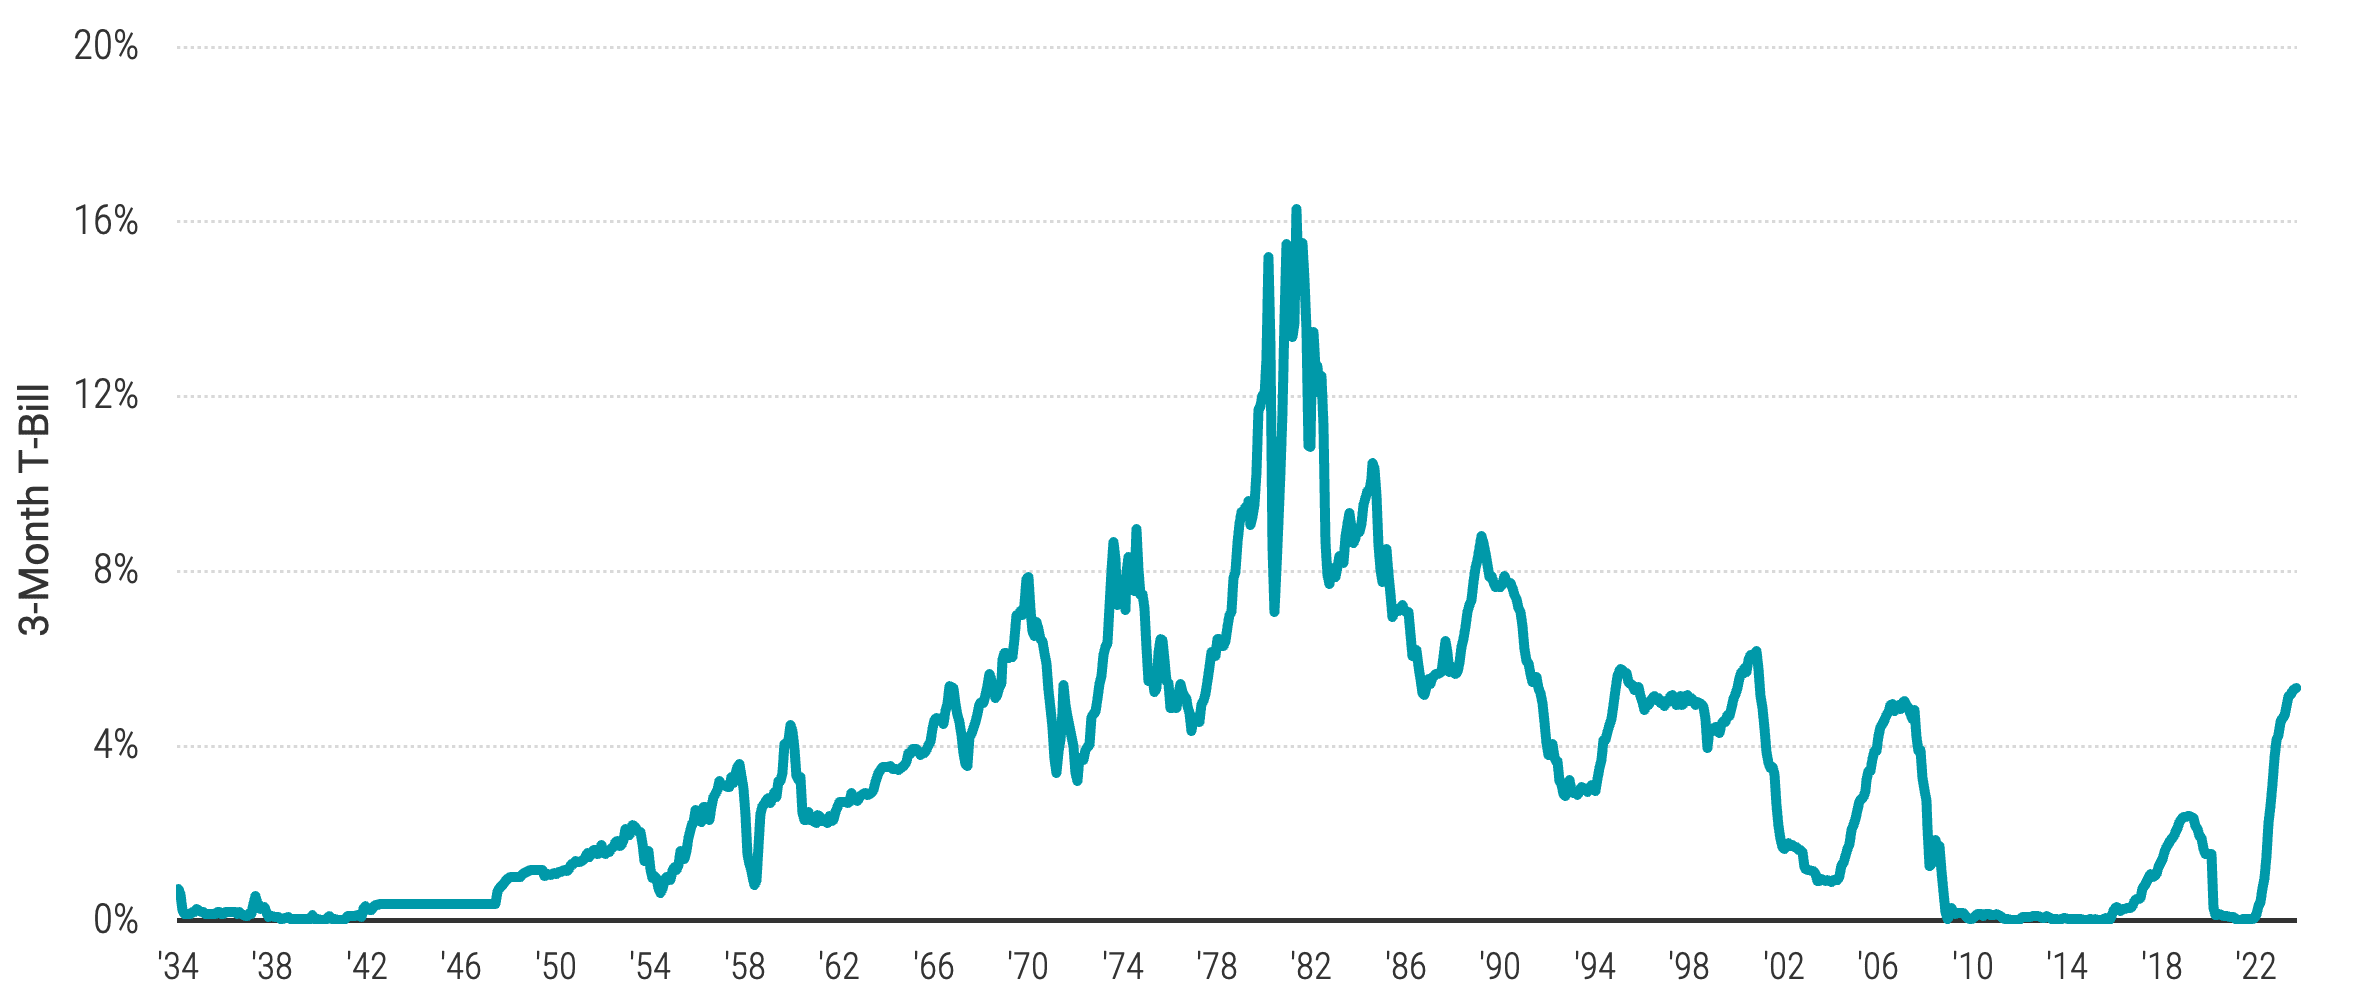
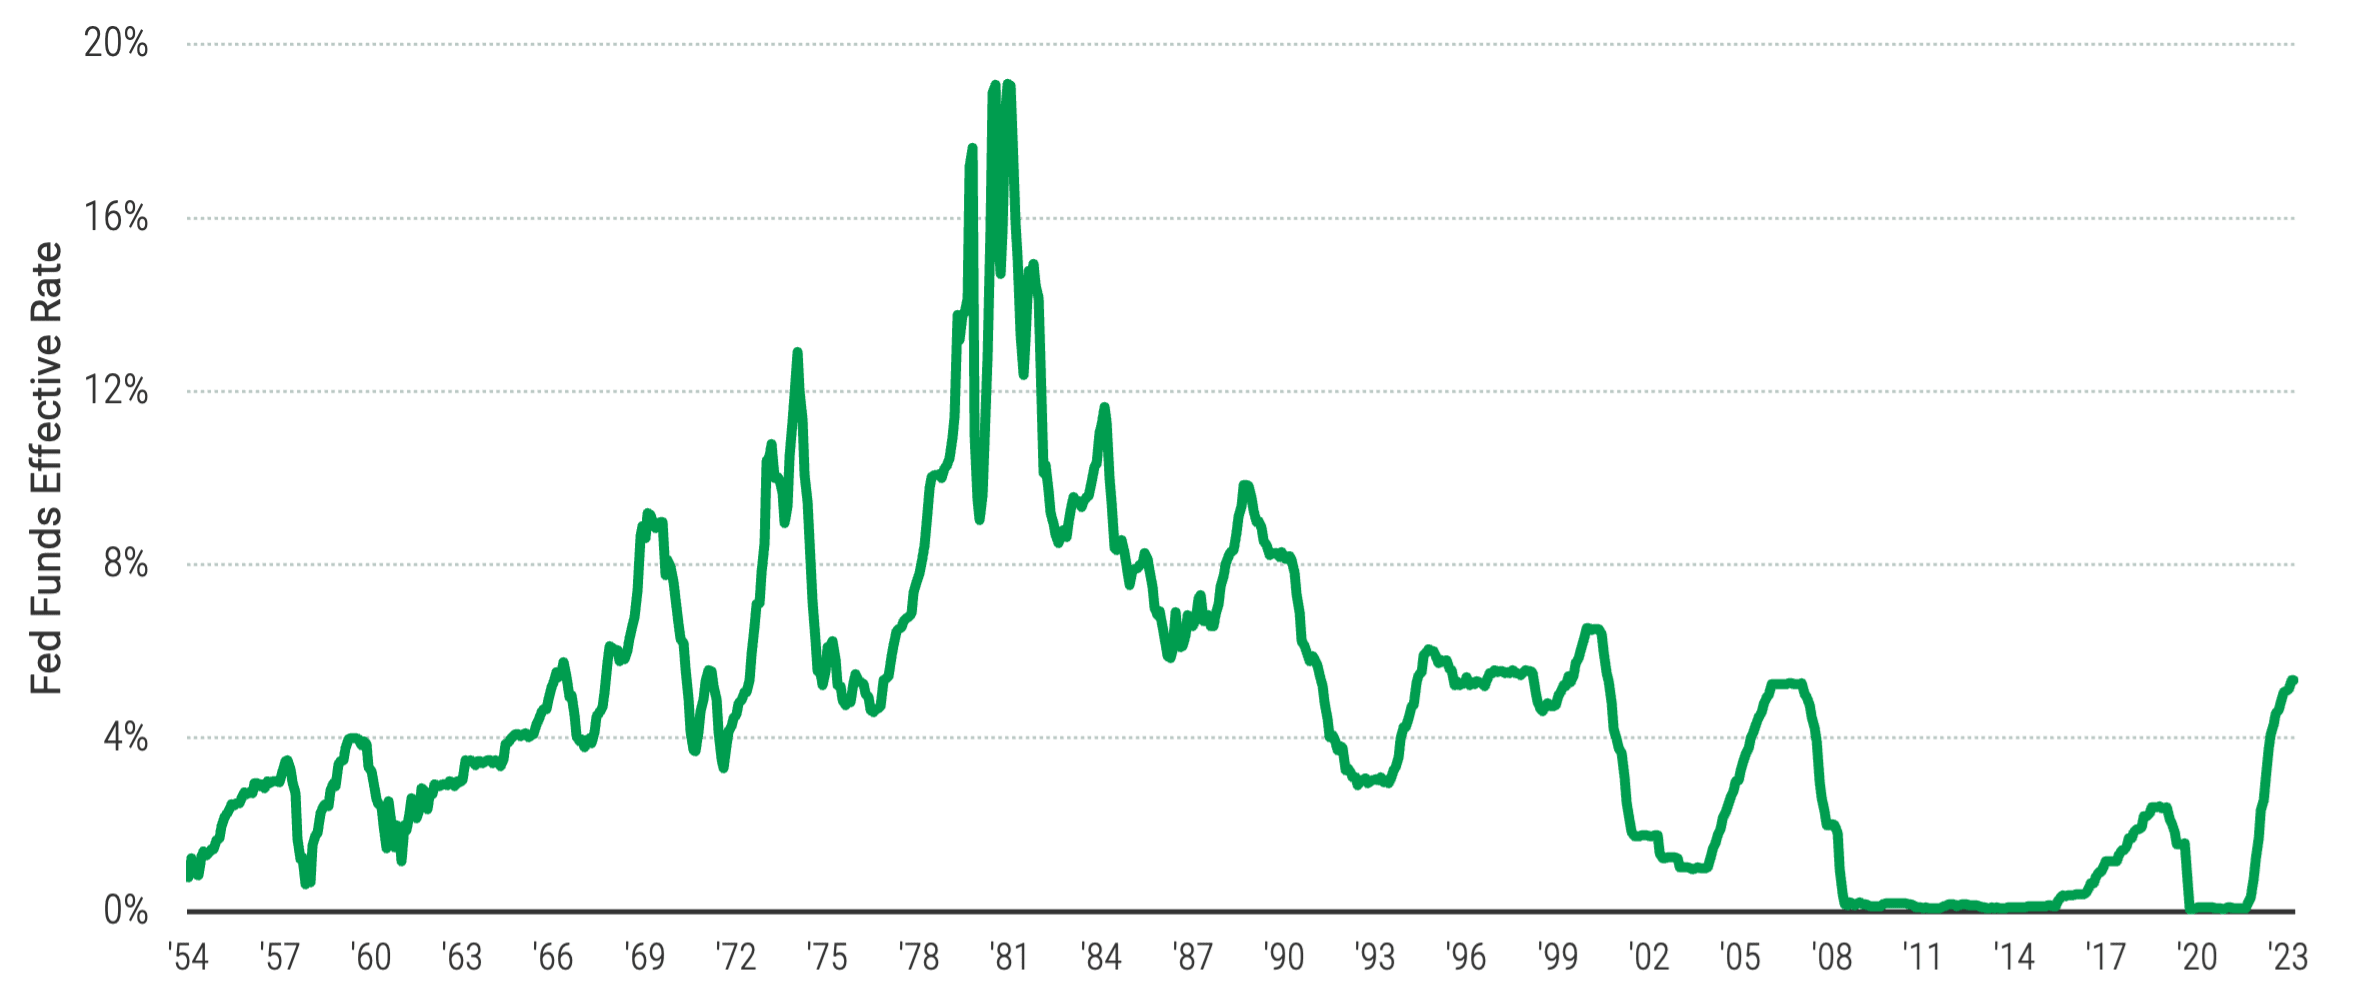
Panel A Chart 1: Data from 1/1/1934 - 7/31/2023. Chart 2: Data from 7/1/1954 - 8/31/2023. Source: Avantis Investors. Data from Federal Reserve Bank of St. Louis.
Panel B | 1-Year U.S. Real GDP Growth vs. Rates at the Start of the Period
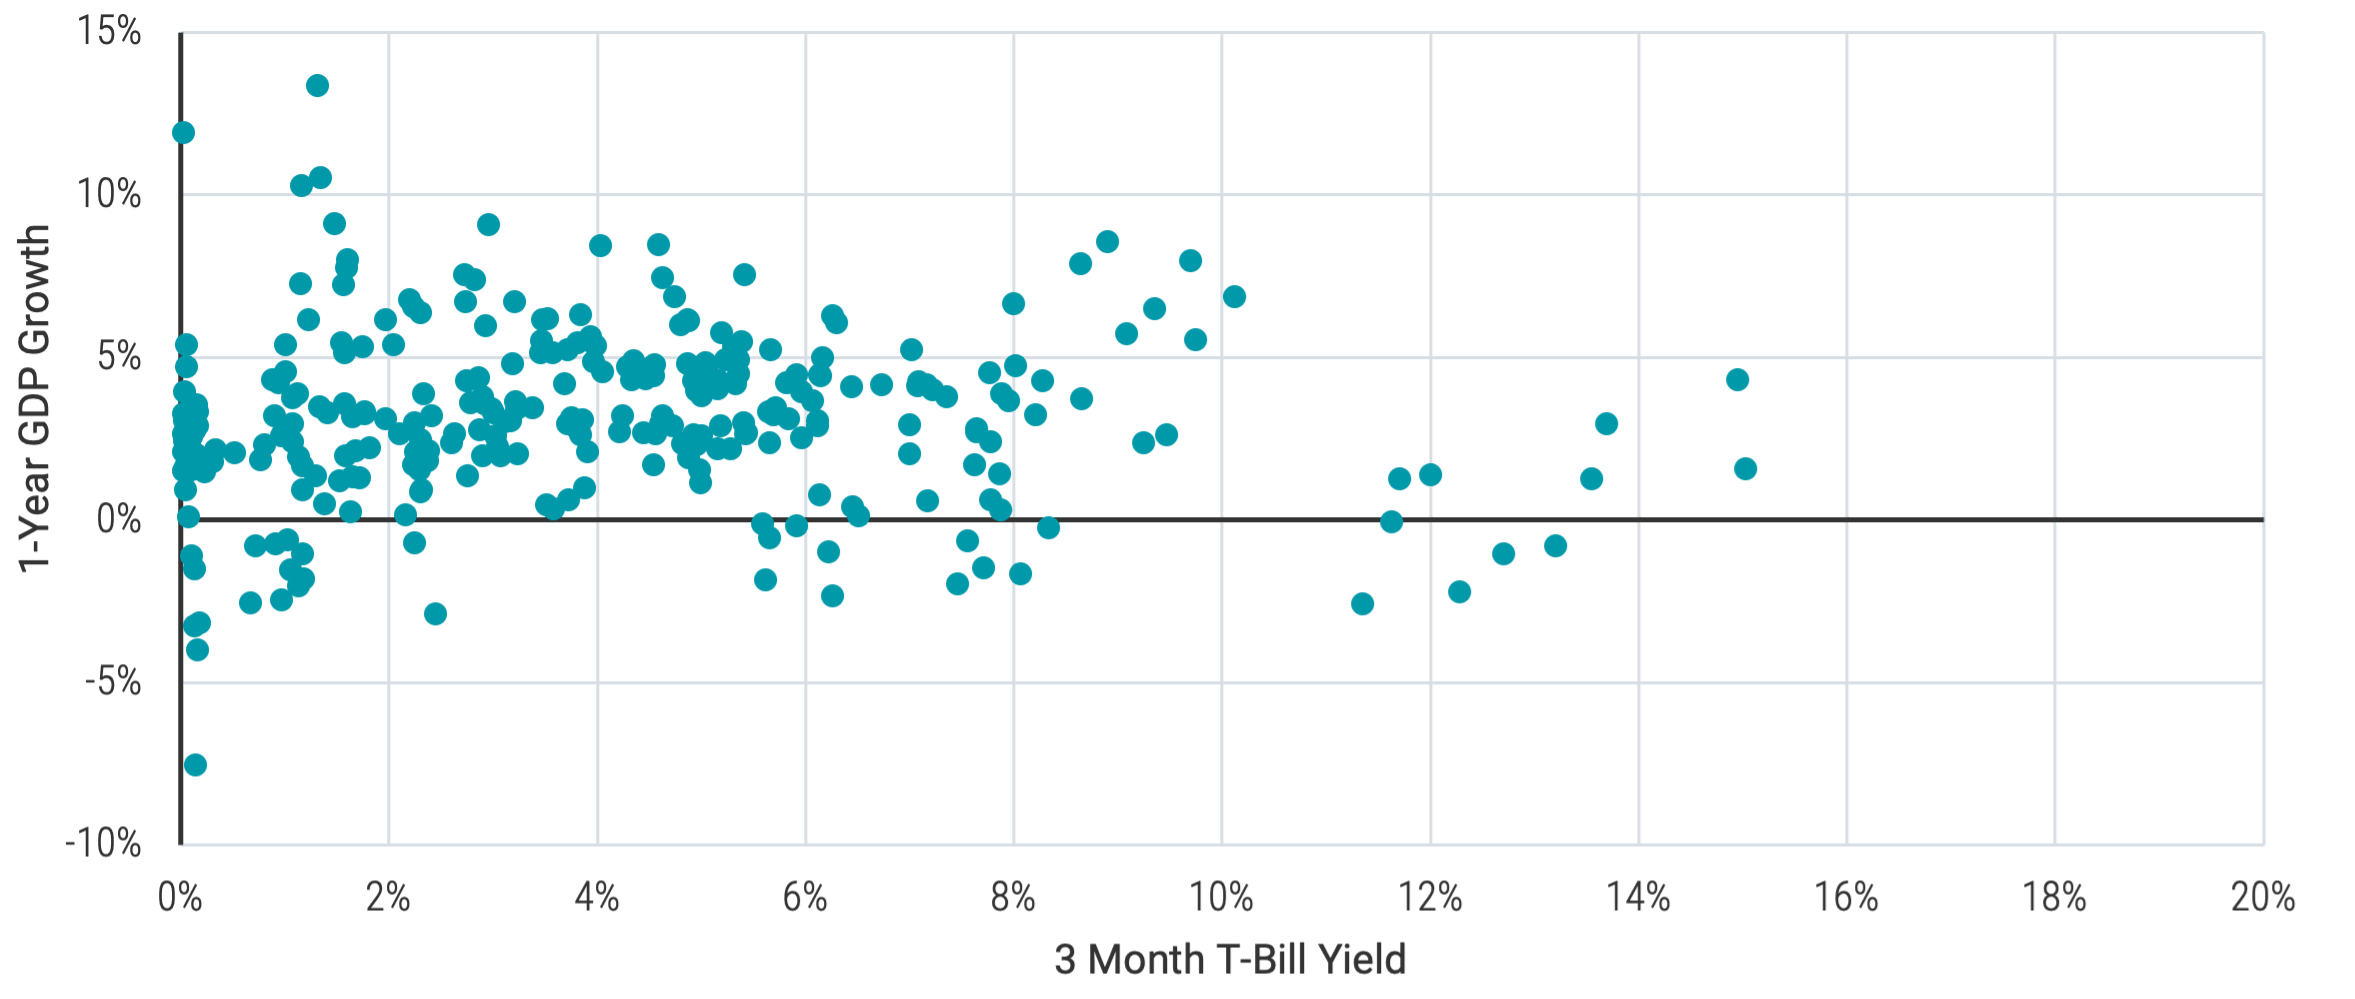
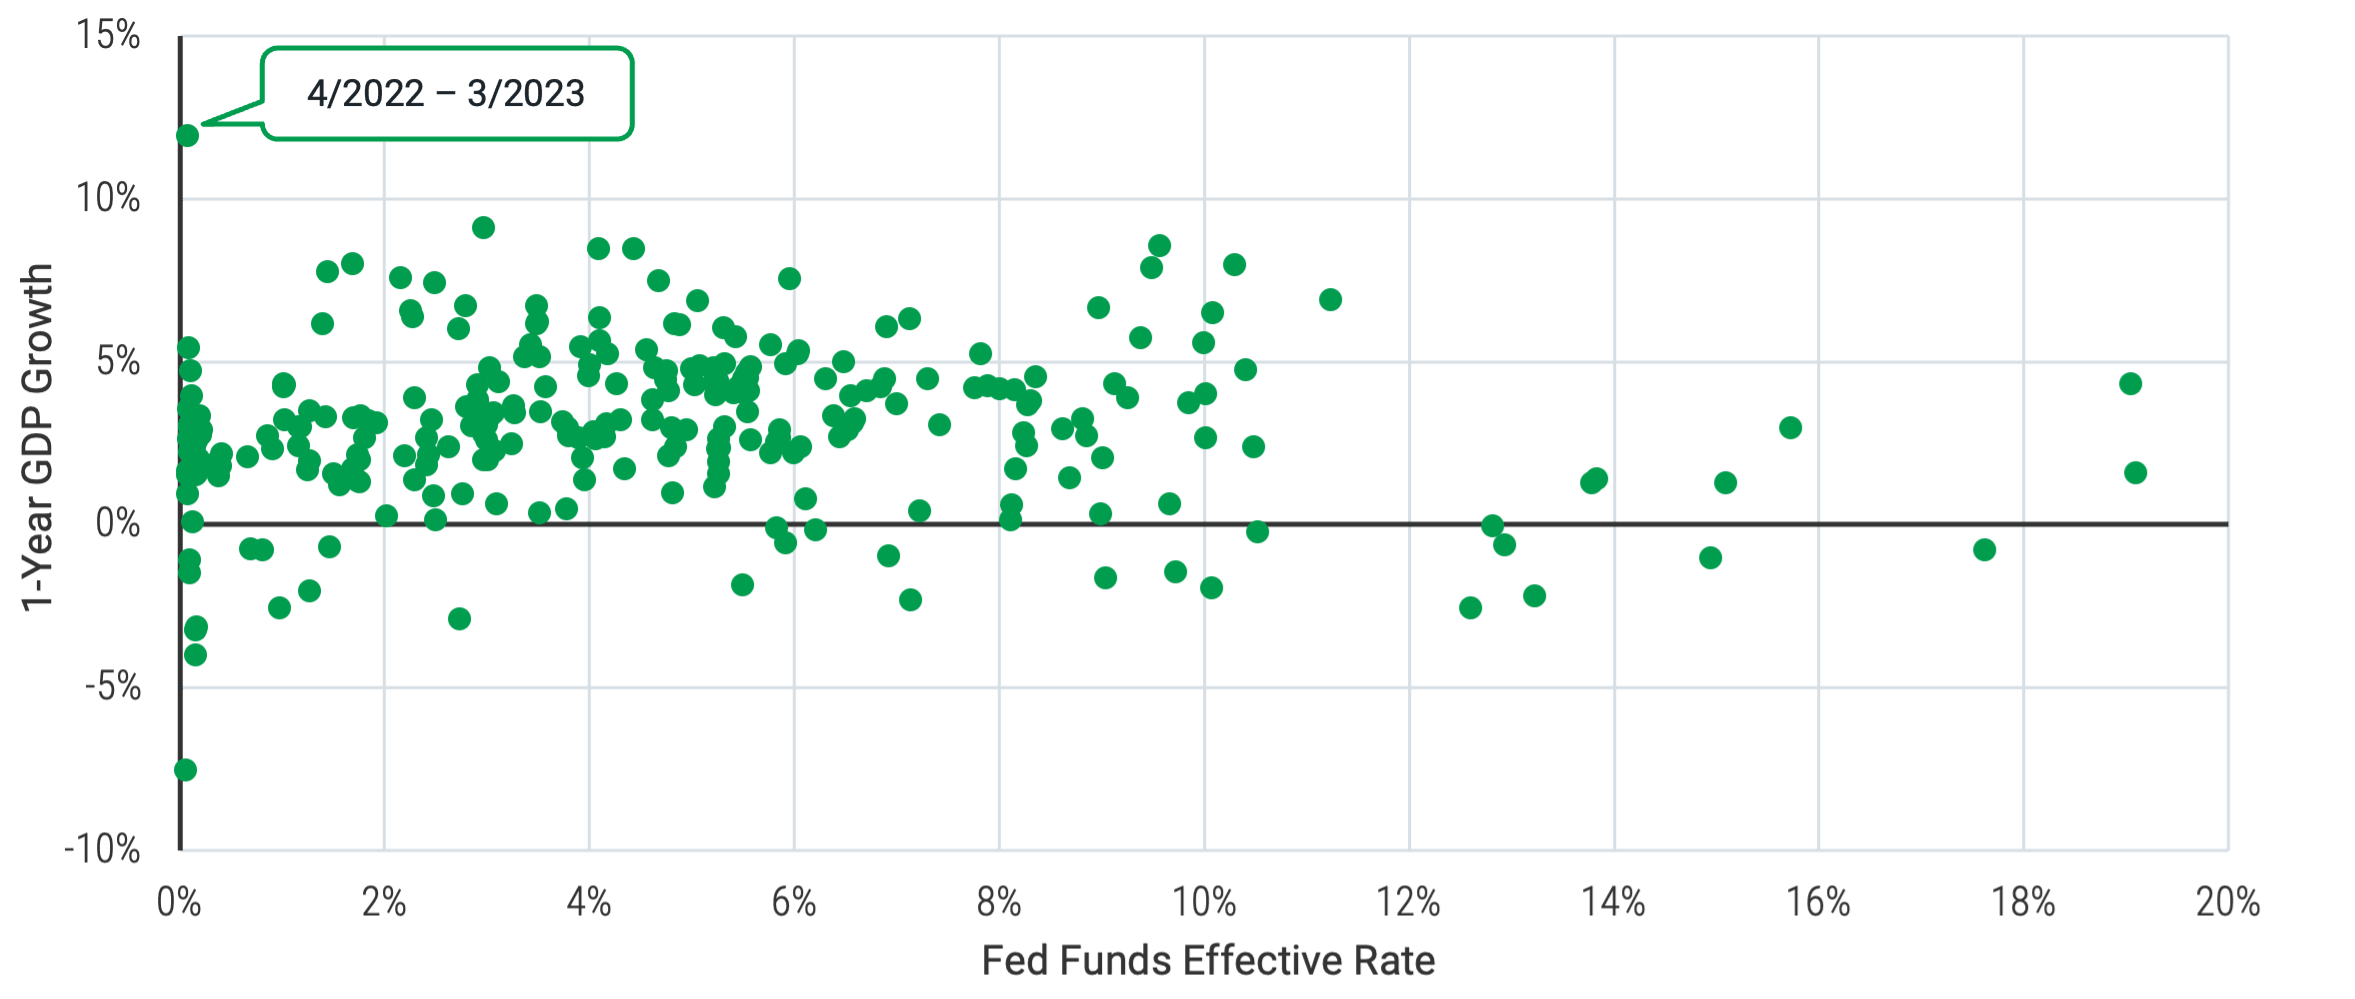
Panel B: Data for both charts from 1/1/1947 - 3/31/2023. Source: Avantis Investors. Data from Federal Reserve Bank of St. Louis.
Do Quickly Rising Rates Guarantee That Economic Growth Will Suffer?
We can also look beyond just the level of rates, as examined in Figure 1, to consider the pace of change. From Panel A in Figure 1, we can see that rate increases over the last 1.5 years have been steep but not unprecedented. Does this rate of change tell us something that rate levels alone don’t?
In Figure 2, we examine the relationship between the change in the three-month T-bill rate over the last 12 months versus GDP growth over the next 12 months.
Figure 2 | The Relationship Between Rate Changes and GDP Growth Is Noisy
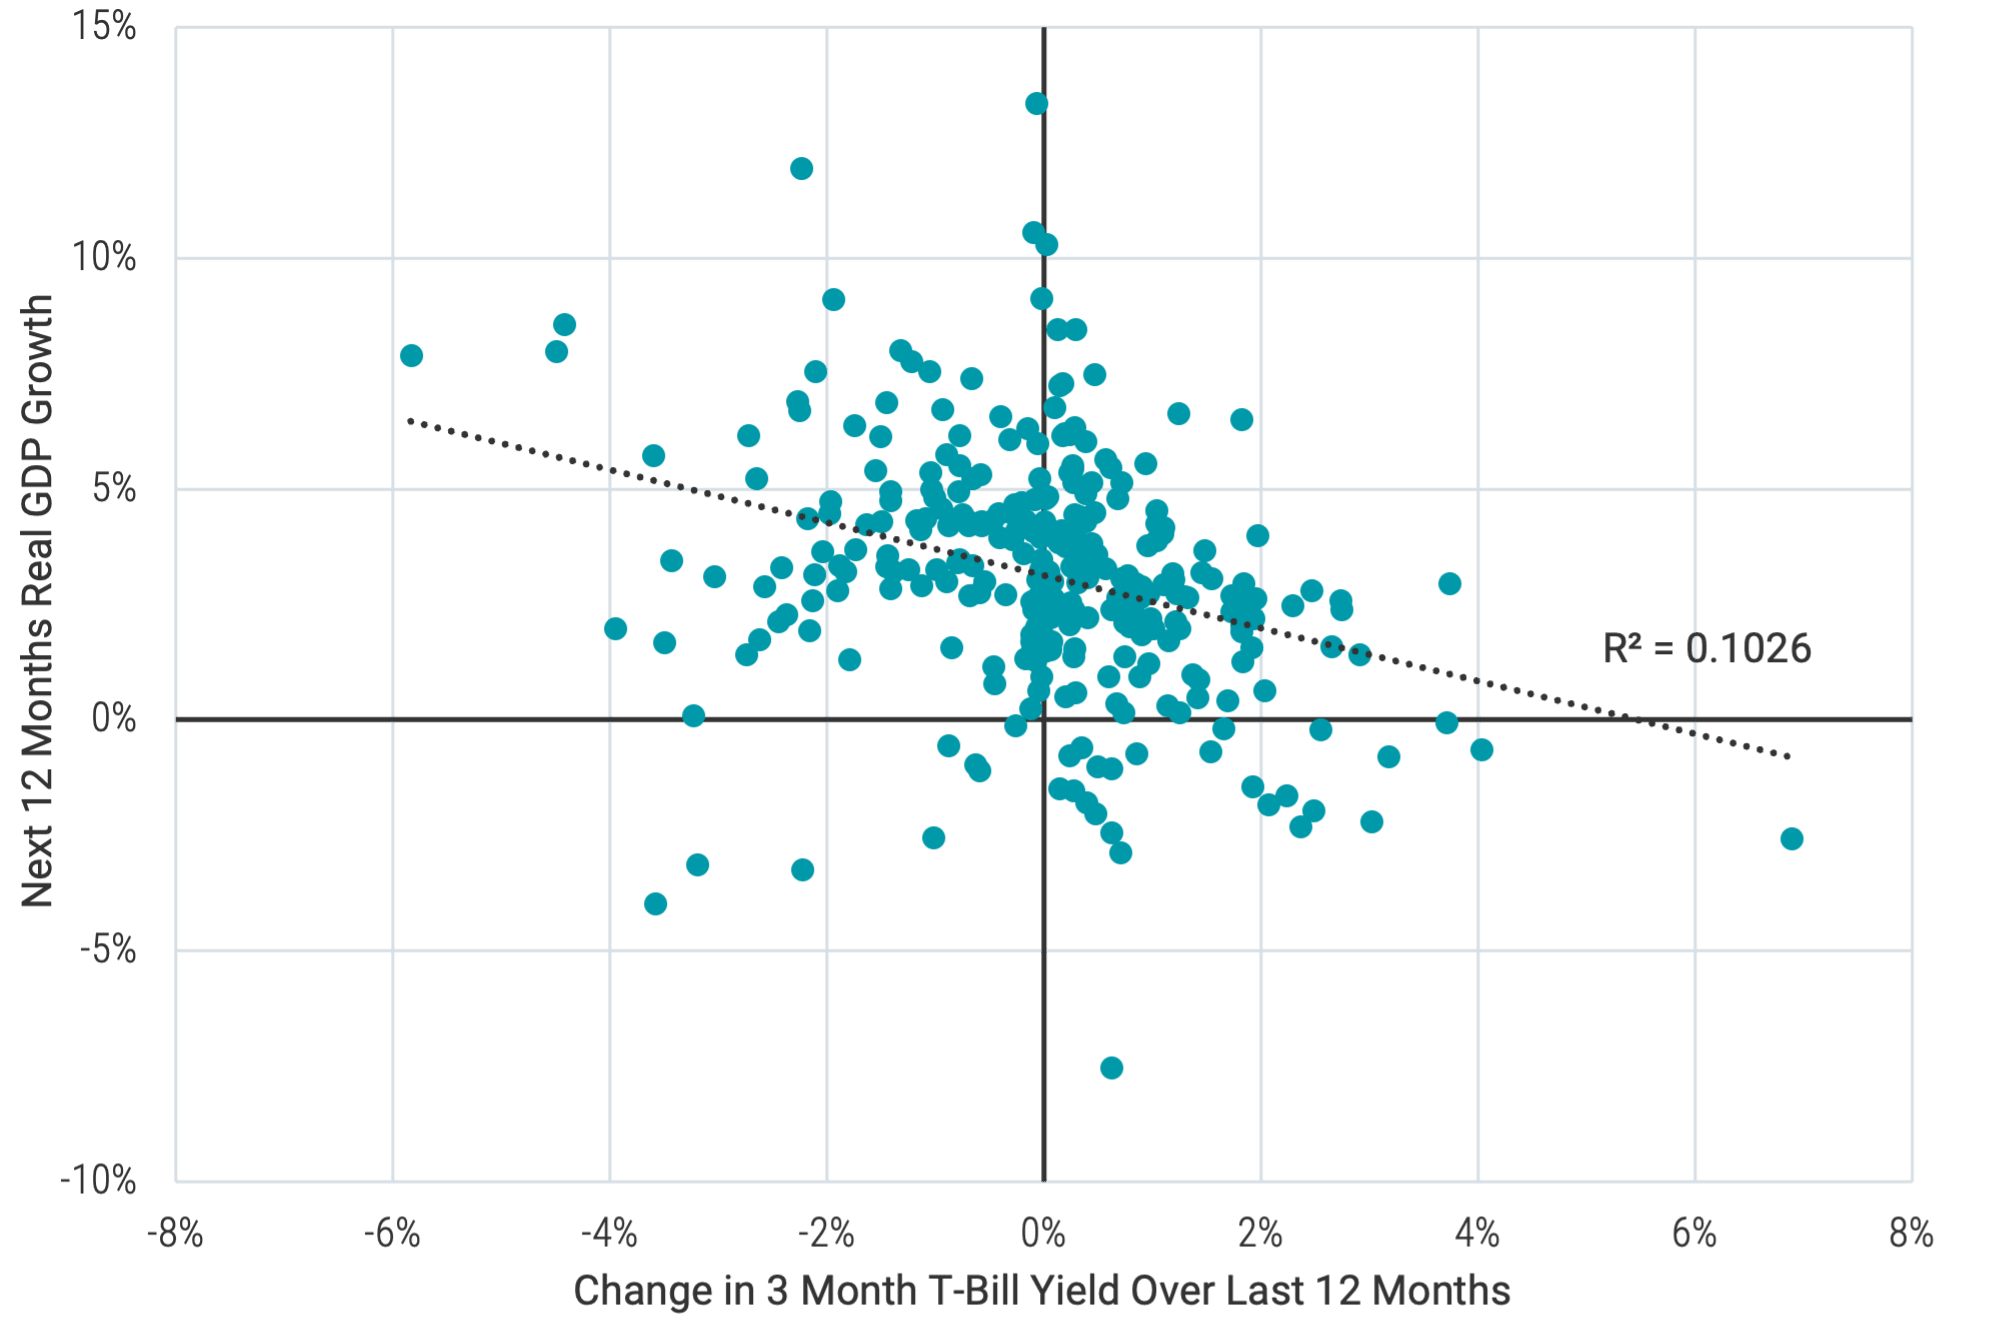
Data from 1/1/1947 - 3/31/2023. Source: Avantis Investors. Data from the Federal Reserve Bank of St. Louis. R-Squared (R²) is a statistical measure in a regression model that determines the proportion of variance in the dependent variable (e.g., GDP growth) that can be explained by the independent variable (e.g., change in 3-month T-Bill). The higher the r-squared, the better the independent variable is explaining variation in the dependent variable.
Plotting the data, we find a negative slope. But it’s easy to see that the relationship is noisy. The pattern is more cloud-like than a clear trend. Further, the R-squared (R2) result is very low, telling us that prior changes in rates offer little explanatory power for the variation in GDP growth rates that follow.
A useful takeaway from these experiments is that far more than interest rates alone can impact economic outcomes. How companies and consumers plan for the potential of rising borrowing costs can play a role (e.g., many businesses refinanced debt when rates were low). Many other variables like net job creation, wage growth, consumer spending or saving, changes in inflation, or even things like extreme weather events can also have an effect. These are just a few examples, and each has uncertainty. We see this uncertainty manifest in our experiments' results, which helps explain why economic predictions can wind up far from reality.
When the Unreliability of Forecasts Becomes Costly
Despite the inherent uncertainty with economic forecasts or their potential impacts on the market, investors often flee stocks when anxiety rises over the potential for tough times ahead. Consider that more than $150 billion has left U.S.-based stock funds since the start of the year. Alternatively, money-market funds, typically perceived as low-risk, low-expected-return investments, have risen sharply and now stand at a near-record $5.6 trillion in total assets.6
The ability of investors to accurately time when to leave the stock market for the safety of money market funds and when to return certainly isn’t stellar, as demonstrated in Figure 3. It presents historical six-month return periods for the S&P 500® Index versus flows for government money market funds over the prior three months.
Figure 3 | Investors Have Not Shown Skill at Timing the Market
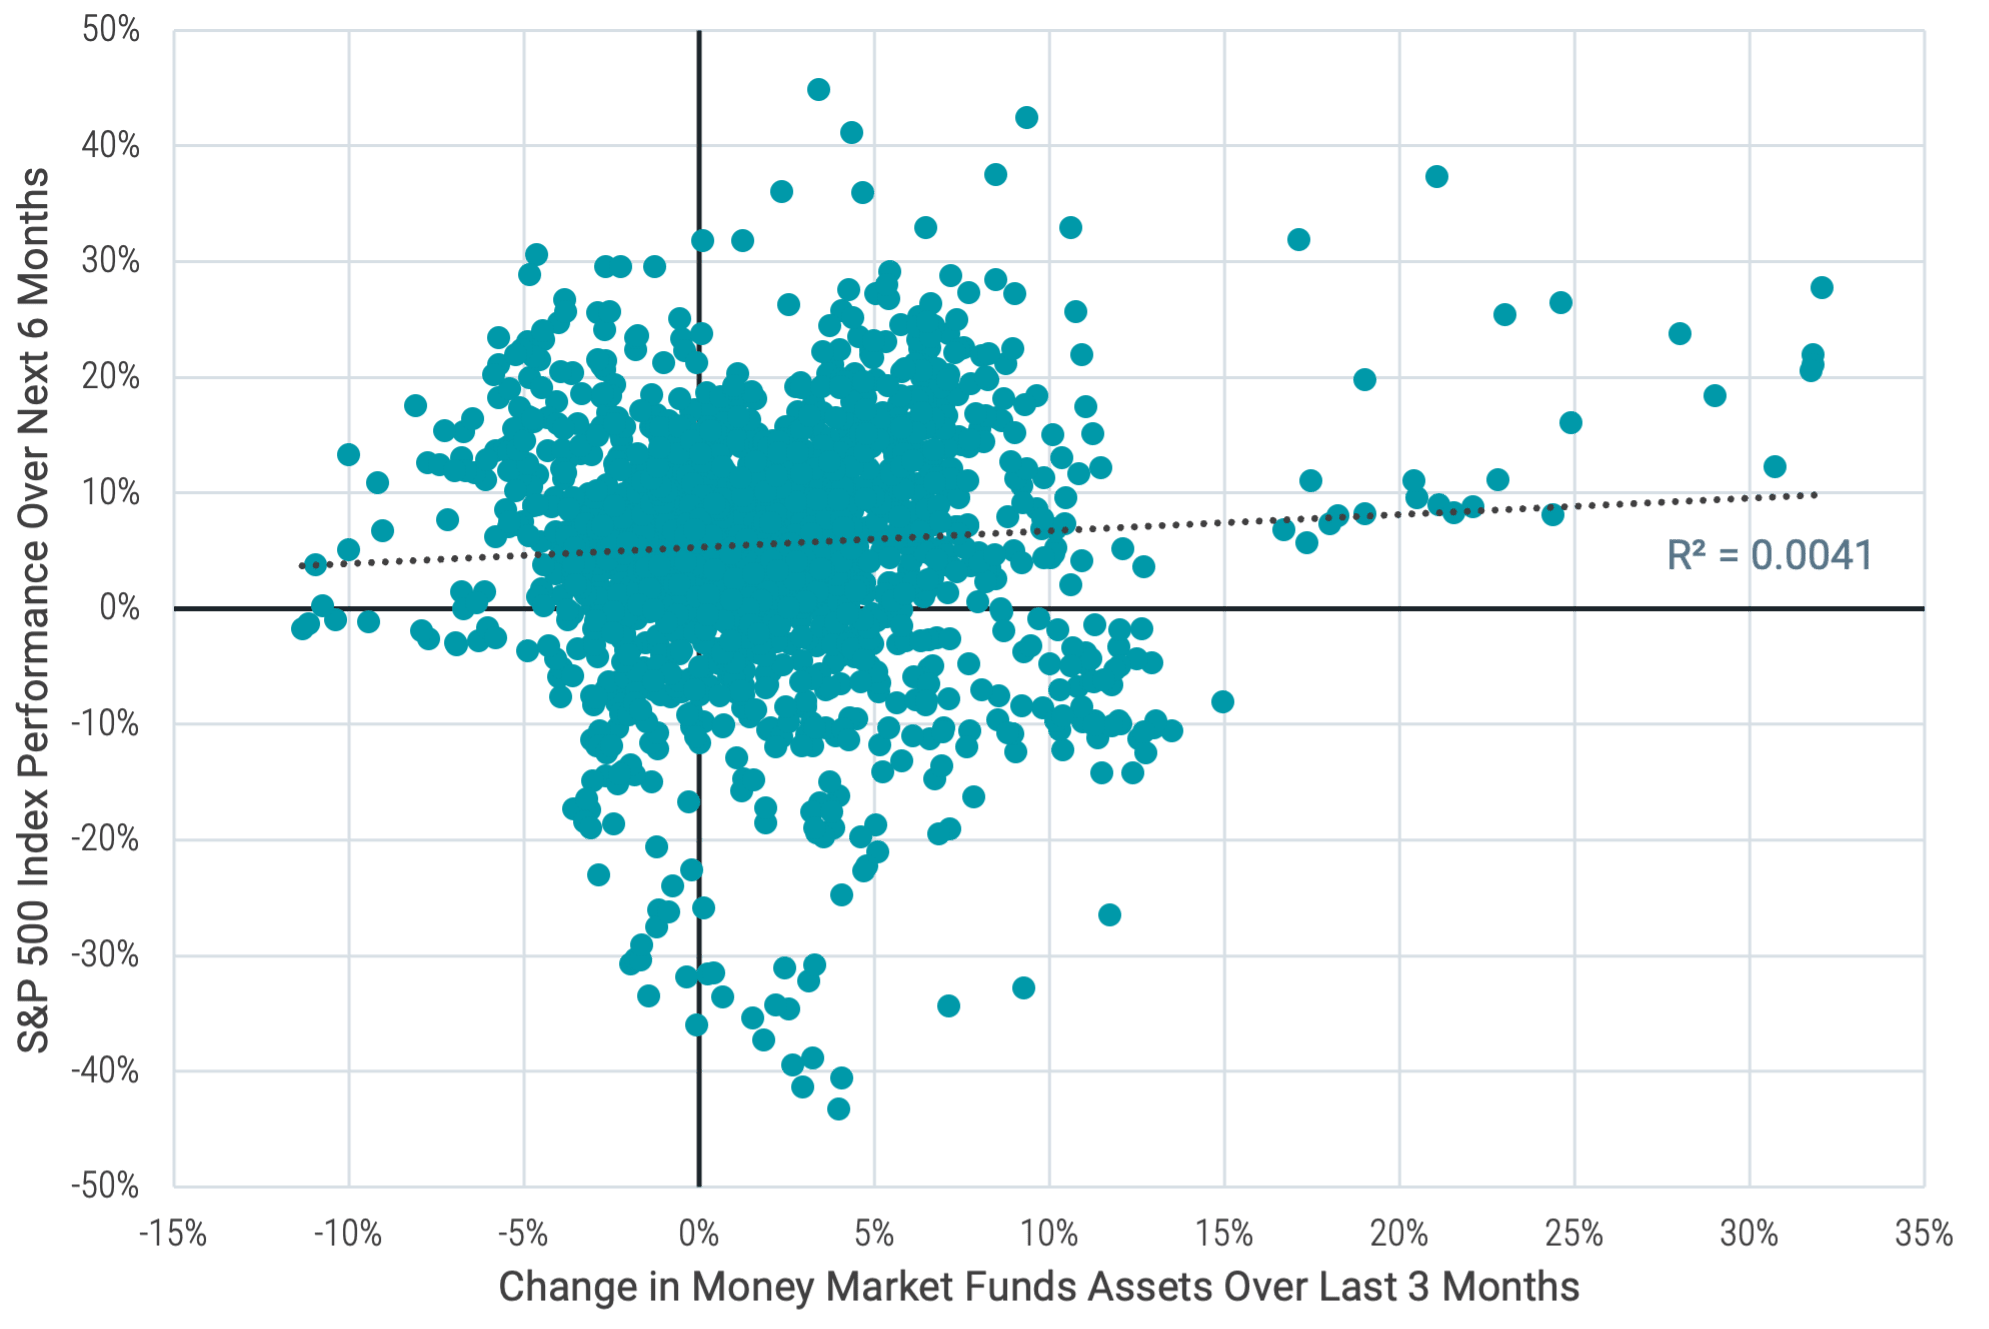
Data from 1/1/1990 - 10/25/2023. Source: Avantis Investors, Bloomberg.
The resulting plot is again a big cloud, showing investors haven’t exhibited any timing skills. If they had, we would see downturns for the S&P 500 after periods when assets grew in money market funds. That’s not the case. Even more, a strategy (Timing Strategy 1) that looked at weekly flows to money market funds and invested in money market instruments after net inflows over the prior week and in the S&P 500 in weeks after net outflows would have historically underperformed the S&P 500.
Perhaps more interesting, that same strategy (Timing Strategy 1) would have also underperformed a strategy (Timing Strategy 2) that does just the opposite, investing in the S&P 500 after weeks of money market fund inflows and moving to money market instruments after outflows. These results are shown in Figure 4.
Figure 4 | Buy-and-Hold vs. Timing Strategies
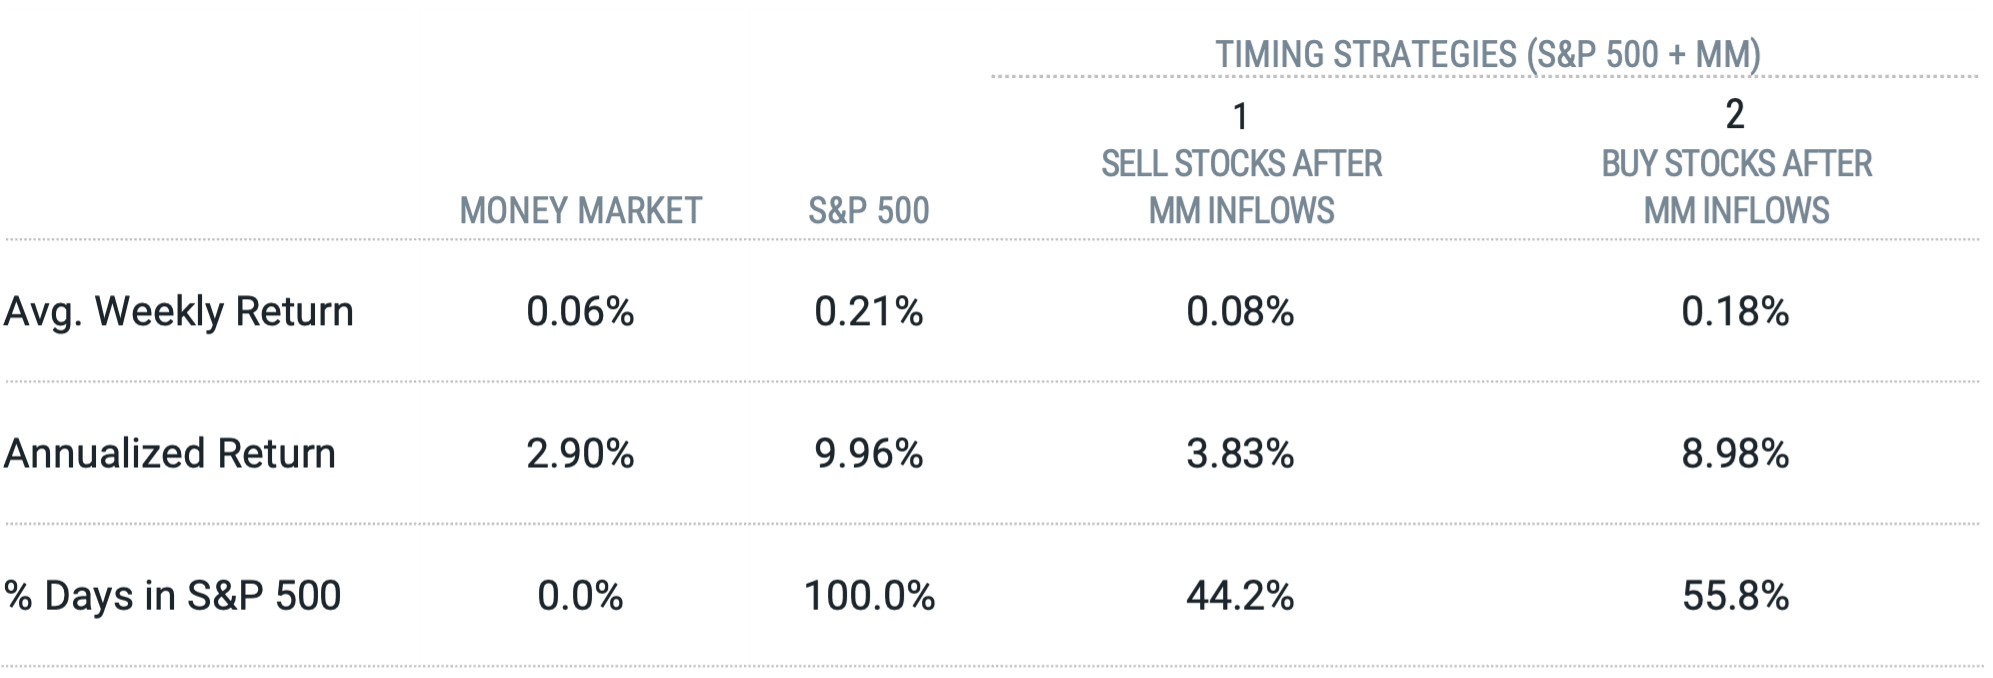
Data from 1/1/1990 - 10/25/2023. Source: Avantis Investors, Bloomberg. MM stands for money market.
Figure 5 shows why focusing on the long-term goal may yield better results than unreliable timing schemes. Since 1947, U.S. GDP (green line) has grown tremendously over time despite many recessions along the way (grey bars). Over time, the broad stock market has also been a remarkable driver for long-term growth of wealth while overcoming countless periods of market anxiety and short-term drawdowns. The “trick” is that realizing these long-term outcomes requires staying the course during heightened uncertainty.
Figure 5 | The Economy Has Overcome Many Rough Periods Over Time
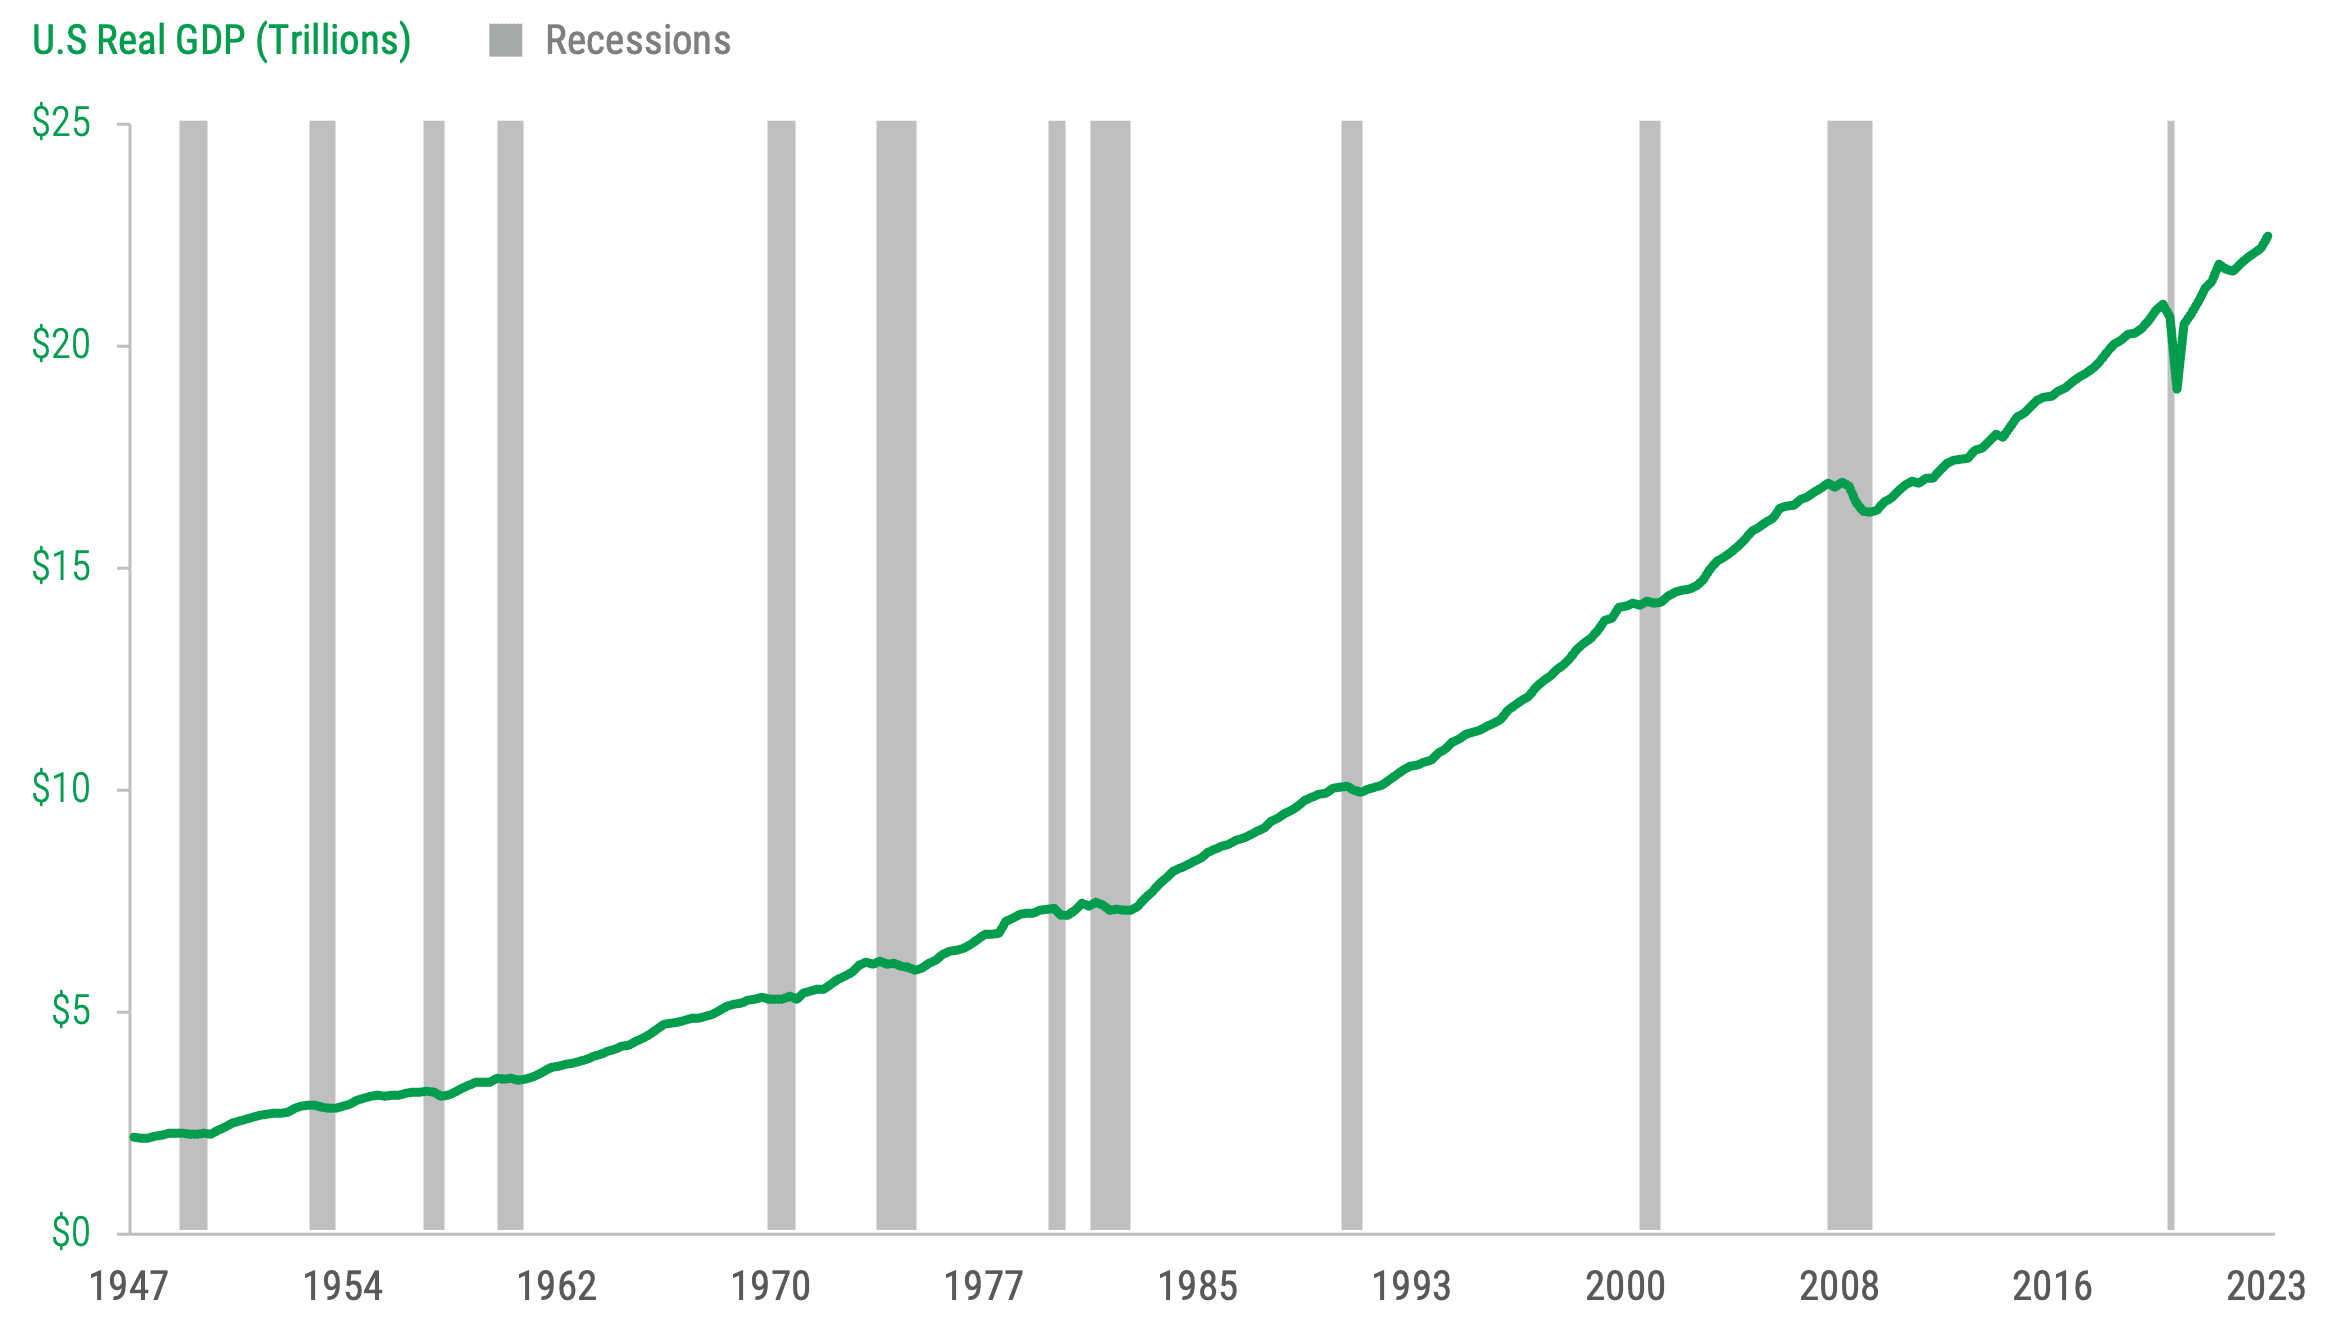
Data from January 1947 - September 2023. Source: Avantis Investors. U.S. real GDP data from the Federal Reserve Bank of St. Louis. Past performance is no guarantee of future results.
Choose Optimism
While there are always reasons to be pessimistic about the economy or the market, there are always reasons to be optimistic. This doesn’t mean that we won’t face bad news about the economy or markets or that the economy won’t, at some point, enter a recession. All that we know for sure is that predictions one way or the other are uncertain.
But we can find comfort in knowing that we’ve been here before. Periods of heightened uncertainty have been overcome countless times, and those who stuck to their plans have often been rewarded. In our view, that’s certainly cause for a bit of optimism.
Glossary
Consumer Price Index (CPI): CPI is a U.S. government (Bureau of Labor Statistics) index derived from detailed consumer spending information. Changes in CPI measure price changes in a market basket of consumer goods and services such as gas, food, clothing, and cars. Core CPI excludes food and energy prices, which tend to be volatile.
Expected Returns: Valuation theory shows that the expected return of a stock is a function of its current price, its book equity (assets minus liabilities) and expected future profits, and that the expected return of a bond is a function of its current yield and its expected capital appreciation (depreciation). We use information in current market prices and company financials to identify differences in expected returns among securities, seeking to overweight securities with higher expected returns based on this current market information. Actual returns may be different than expected returns, and there is no guarantee that the strategy will be successful.
Federal Funds Rate: The federal funds rate is an overnight interest rate banks charge each other for loans. More specifically, it's the interest rate charged by banks with excess reserves at a Federal Reserve district bank to banks needing overnight loans to meet reserve requirements. It's an interest rate that's mentioned frequently within the context of the Federal Reserve's interest rate policies. The Federal Reserve's Open Market Committee sets a target for the federal funds rate (which is a key benchmark for all short-term interest rates, especially in the money markets), which it then supports/strives for with its open market operations (buying or selling government securities).
Gross Domestic Product (GDP): A measure of the total economic output in goods and services for an economy.
Money Market Instruments: Short-term debt instruments (such as certificates of deposit, commercial paper, Treasury bills, banker's acceptances, and repurchase agreements) that are valued for their relative safety and liquidity.
Personal Consumption Expenditures (PCE): The PCE price deflator — which comes from the Bureau of Economic Analysis' quarterly report on U.S. GDP — is based on a survey of businesses and is intended to capture the price changes in all final goods, no matter the purchaser. Because of its broader scope and certain differences in the methodology used to calculate the PCE price index, the Federal Reserve holds the PCE deflator as its preferred, consistent measure of inflation over time.
S&P 500® Index: A market-capitalization-weighted index of the 500 largest U.S. publicly traded companies. The index is widely regarded as the best gauge of large-cap U.S. equities. It is not possible to invest directly in an index.
Treasury Securities: Debt securities issued by the U.S. Treasury and backed by the direct "full faith and credit" pledge of the U.S. government. Treasury securities include bills (maturing in one year or less), notes (maturing in two to 10 years) and bonds (maturing in more than 10 years). They are generally considered among the highest quality and most liquid securities in the world.
ENDNOTES
1 Vince Golle and Kyungjin Yoo, “Economists Place 70% Chance for U.S. Recession in 2023,” Bloomberg, December 20, 2022.
2 U.S. Bureau of Economic Analysis, “Gross Domestic Product, Third Quarter 2023 (Advance Estimate),” News Release, October 26, 2023.
3 U.S. Bureau of Labor Statistics, “Consumer Price Index Summary,” Economic News Release, October 12, 2023.
4 U.S. Bureau of Economic Analysis, “Gross Domestic Product, Third Quarter 2023 (Advance Estimate),” News Release, October 26, 2023.
5 U.S. Bureau of Labor Statistics, “The Employment Situation – September 2023,” News Release, October 6, 2023.
6 Investment Company Institute (ICI), “Money Market Fund Assets,” News Release, October 26, 2023.
Investment return and principal value of security investments will fluctuate. The value at the time of redemption may be more or less than the original cost. Past performance is no guarantee of future results.
This material has been prepared for educational purposes only. It is not intended to provide, and should not be relied upon for, investment, accounting, legal or tax advice.
The opinions expressed are those of the portfolio team and are no guarantee of the future performance of any Avantis fund.