
Capturing the Value Premium in Small Caps: An Analysis of Performance in 2020
Value stocks have historically delivered a premium relative to growth stocks over long periods, but the recent prolonged period of value stocks lagging their growth counterparts has prompted many investors to wonder if their portfolios are properly positioned to capture the premium when value makes a comeback. The answer hinges, in part, on the objectives for a portfolio’s equity holdings (e.g., size of value allocation relative to growth allocation) and the allocator’s definition of value.
Plenty of research compares the various definitions of value. The benefits of using a more wholistic view of companies by considering equity and flow variables in a valuation framework, instead of just using raw book/price, for example, has been well documented in various papers, see Wahal and Repetto 2020.¹ How that translates into capturing the premium when value comes back, however, requires further analysis of the available options.
While cumulative results relative to a benchmark provide some insight, we can also evaluate relative performance over shorter periods to examine how various funds performed when the value premium was positive or negative.
In our analysis, we examined the daily returns for all the U.S. small value strategies (based on Morningstar’s category definition) for calendar year 2020 and grouped them based on positive and negative value premium days within U.S. small caps. (The value “premium” is measured as the return of the Russell 2000® Value Index minus the return of the Russell 2000® Growth Index). To be eligible for inclusion, the fund must have existed at the beginning of the sample period. Figure 1 includes a summary of the results. In 2020, the value premium in small caps was positive on 107 days and negative on 146 days.
Figure 1 | Do Small Cap Value Funds Capture Value?
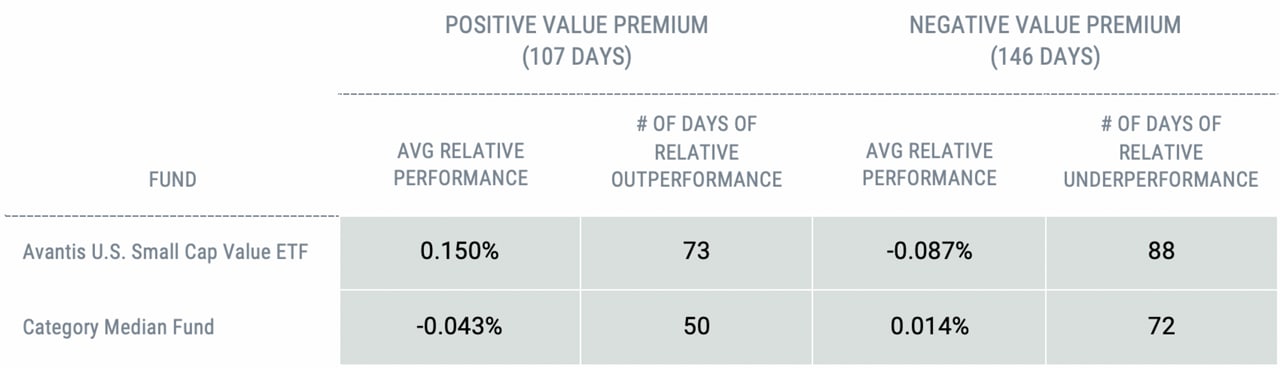
Data from 1/2/20 – 12/31/20. Sources: Avantis Investors and Morningstar Direct. Relative performance measured versus the Russell 2000 Value Index.
What did we find? The Avantis U.S. Small Cap Value ETF outperformed the Russell 2000 Value Index by an average of 15 bps on the 107 days the value premium was positive in small caps and underperformed the Russell 2000 Value Index by an average of 8.7 bps on the 146 days when the value premium was negative. This result should be expected from a strategy highly focused on capturing the value premium in small caps. On the other hand, the Category Median Fund underperformed, on average, when the value premium was positive and slightly outperformed when the value premium was negative. This reveals that the median fund has more diluted small value exposure than the Russell 2000 Value benchmark.
We have included a scatter plot of the daily returns to demonstrate the relationship and level of dispersion among fund returns in the universe. Figure 2 shows the relationship between the daily performance of AVUV (blue dots) in excess of the Russell 2000 Value index on the vertical axis. On the horizontal axis, we show the value premium in small caps on a given day, using the difference between the Russell 2000 Value and Russell 2000 Growth indices as a proxy. For reference, we also include plots for the 25th percentile manager (green dots) and the 75th percentile manager (red dots).
For AVUV, the blue dots tend to be higher on the right side of the chart indicating stronger outperformance when the value premium is positive. This is also demonstrated by the slope of the distribution of relative results (blue line). The slightly negatively sloped distribution for the median fund referenced in Figure 1 is shown in pink.
Figure 2 | Daily Premium Performance vs. Relative Performance of Small Value Funds
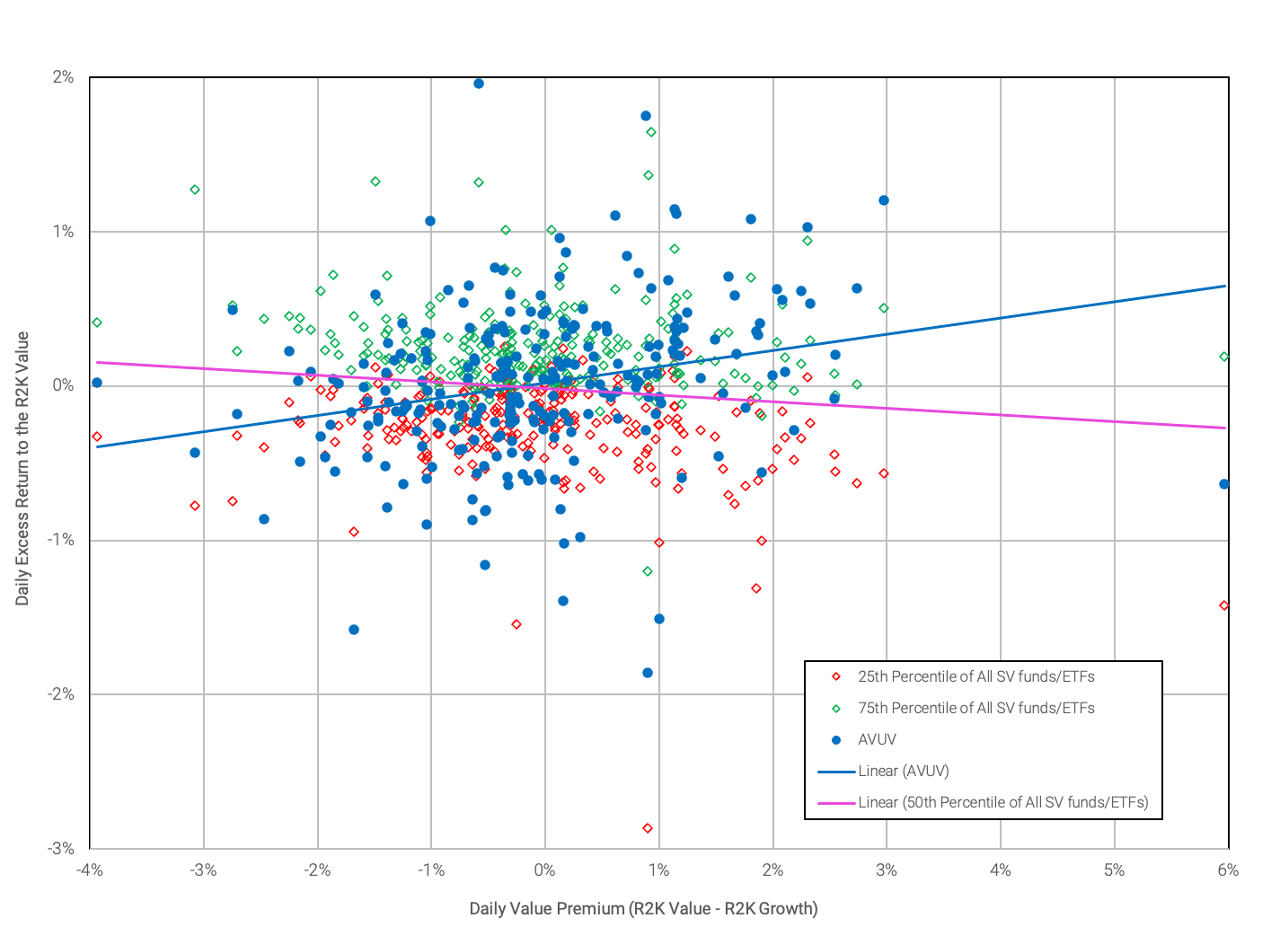
Data from 1/2/2020 – 12/31/2020. Source: Morningstar Direct.
All Small Value Funds Aren’t Created Equal
We believe these results present two important conclusions. First, not all small value funds are created equal. Even within Morningstar’s U.S. Small Cap Value category peer group, construction and composition differ significantly among strategies. We found many funds—including some of the largest by assets under management in the universe—whose daily performance relative to the Russell 2000 Value index was inversely correlated with the value premium in small caps. These strategies actually did better when value underperformed.
Second, investors can evaluate performance through several lenses. For those seeking to effectively target a certain asset class, understanding a portfolio’s ability to consistently deliver the intended asset class is an important consideration. The analysis we conducted focused on daily returns, but it has longer-term implications. For systematic strategies, the ability to efficiently maintain the desired exposure every day increases the reliability of realized longer-term results more closely aligned with expectations.
¹Sunil Wahal and Eduardo Repetto, On the Conjoint Nature of Value and Profitability (June 25, 2020). Available at SSRN: HTTPS://DX.DOI.ORG/10.2139/SSRN.3635714 >.
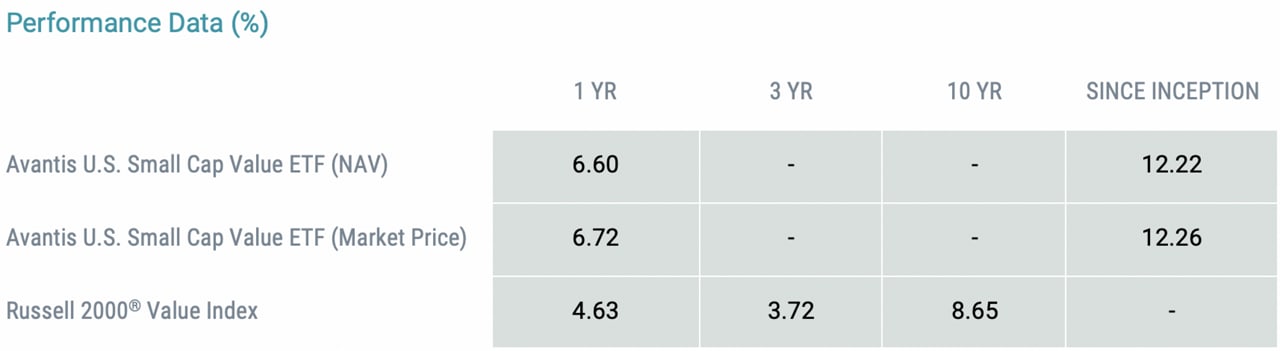
Data as of 12/31/2020. Performance data quoted represents past performance and is no guarantee of future results. Current performance may be lower or higher than the performance data quoted. Investment return and principal value will fluctuate so that an investor's shares, when redeemed, may be worth more or less than original cost. Returns less than one year are not annualized. NAV prices are used to calculate market price performance prior to the date when the Fund first traded on the New York Stock Exchange. Market performance is determined using the bid/ask midpoint at 4:00 p.m. Eastern time, when the NAV is typically calculated. Market performance does not represent the returns you would receive if you traded shares at other times. Index performance does not represent the fund's performance. It is not possible to invest directly in an index. View Current Fund Performance
Exchange Traded Funds (ETFs) are bought and sold through exchange trading at market price (not NAV), and are not individually redeemed from the fund. Shares may trade at a premium or discount to their NAV in the secondary market. Brokerage commissions will reduce returns.
You should consider the fund’s investment objectives, risks, and charges and expenses carefully before you invest. The fund’s prospectus or summary prospectus, which can be obtained by visiting Avantisinvestors.com or by calling 833-928-2684, contains this and other information about the fund, and should be read carefully before investing. Investments are subject to market risk.
This fund is an actively managed Exchange Traded Fund (ETF) that does not seek to replicate the performance of a specified index. To determine whether to buy or sell a security, the portfolio managers consider, among other things, various fund requirements and standards, along with economic conditions, alternative investments, interest rates and various credit metrics. If the portfolio manager considerations are inaccurate or misapplied, the fund’s performance may suffer.
Historically, small- and/or mid-cap stocks have been more volatile than the stock of larger, more established companies. Smaller companies may have limited resources, product lines and markets, and their securities may trade less frequently and in more limited volumes than the securities of larger companies.
Derivatives may be more sensitive to changes in market conditions and may amplify risks.
Past performance is no guarantee of future results.
Our philosophy is based on the idea that paying less for an expected stream of cash flows or the equity of a company should produce higher expected returns. Our systematic, repeatable and cost-efficient process uniquely designed for Avantis Investors is actively implemented to deliver diversified portfolios expected to harness those higher expected returns.
This material has been prepared for educational purposes only. It is not intended to provide, and should not be relied upon for, investment, accounting, legal or tax advice.
The opinions expressed are those of the investment portfolio team and are no guarantee of the future performance of any Avantis Investors portfolio. This information is not intended as a personalized recommendation or fiduciary advice and should not be relied upon for investment, accounting, legal or tax advice. References to specific securities are for illustrative purposes only and are not intended as recommendations to purchase or sell securities.
Investment return and principal value of security investments will fluctuate. The value at the time of redemption may be more or less than the original cost. Past performance is no guarantee of future results.
The contents of this Avantis Investors presentation are protected by applicable copyright and trade laws. No permission is granted to copy, redistribute, modify, post or frame any text, graphics, images, trademarks, designs or logos.
Exchange Traded Funds (ETFs): Foreside Fund Services, LLC – Distributor, not affiliated with American Century Investment Services, Inc.
FOR FINANCIAL PROFESSIONAL USE ONLY/ NOT FOR DISTRIBUTION TO THE PUBLIC