Can Growth Stocks Get Growthier? An Update on Valuations
It seems like a day doesn’t go by without Tesla’s rocketing stock price capturing headlines. How can investors make sense of the looming threats related to COVID-19 and an economic downturn versus a stock market that has positive returns so far this year? Through July 20, the S&P 500® Index and Russell 3000® Index are each up between 1-2% year-to-date.
If we break down the market further into components, growth stocks have been the clear winner. Consider the year-to-date performance for size and style groupings in Figure 1. Large-cap growth stocks have beaten large value stocks by more than 30% and small-cap value stocks by more than 40%.
FIGURE 1 | LARGE-CAP GROWTH OUTPERFORMS IN 2020

Data from 1/1/2020-7/20/2020. Size and style represented by Russell indices. Source: Morningstar.
These are big numbers, but what drives that performance? Growth stocks typically trade at higher multiples than value stocks (relative to earnings, for example) because investors are baking in higher growth expectations for future earnings, but the higher the price the lower the expected returns unless these growth expectations materialize and keep growing.
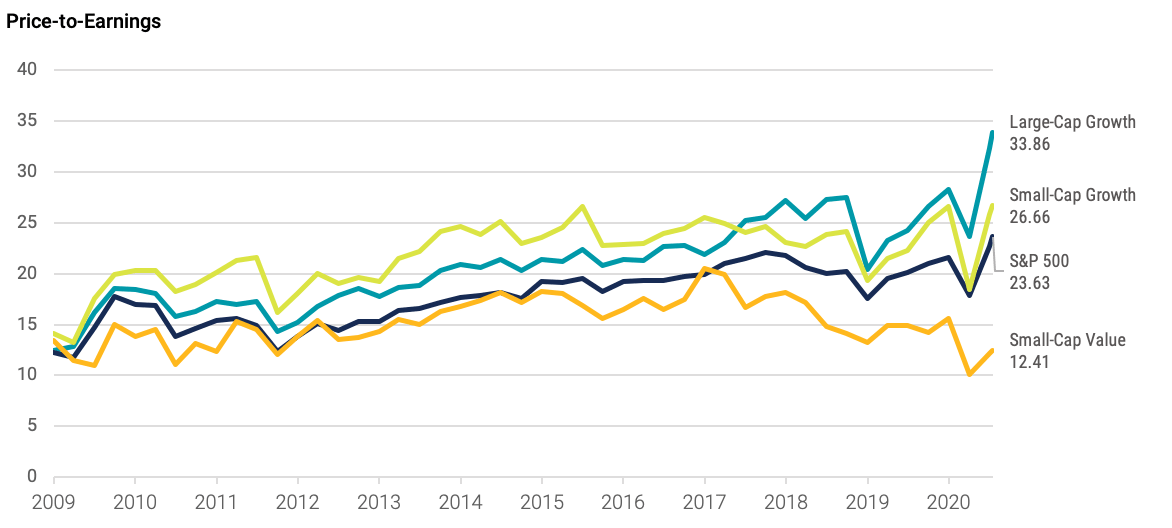
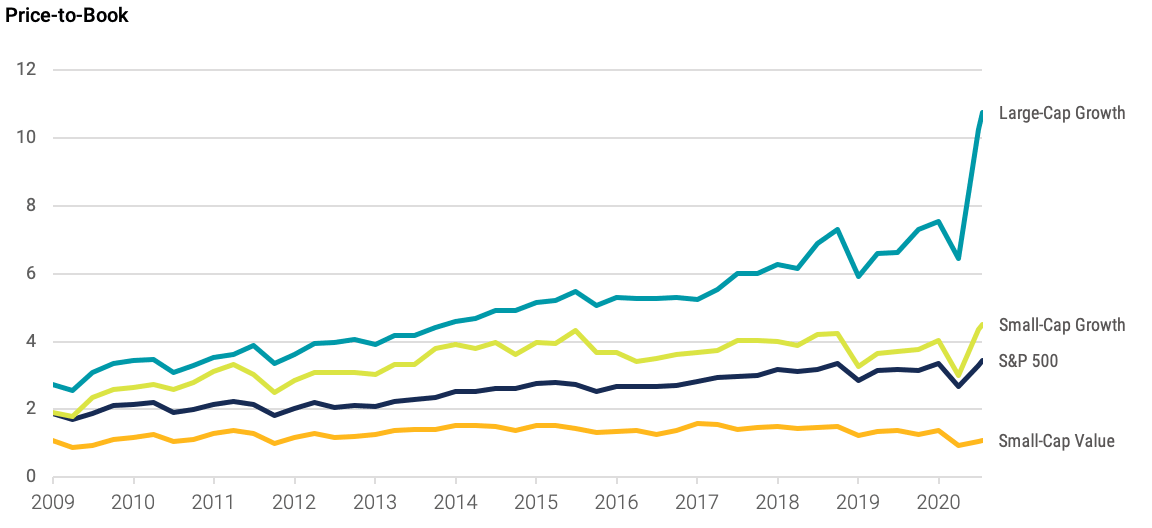
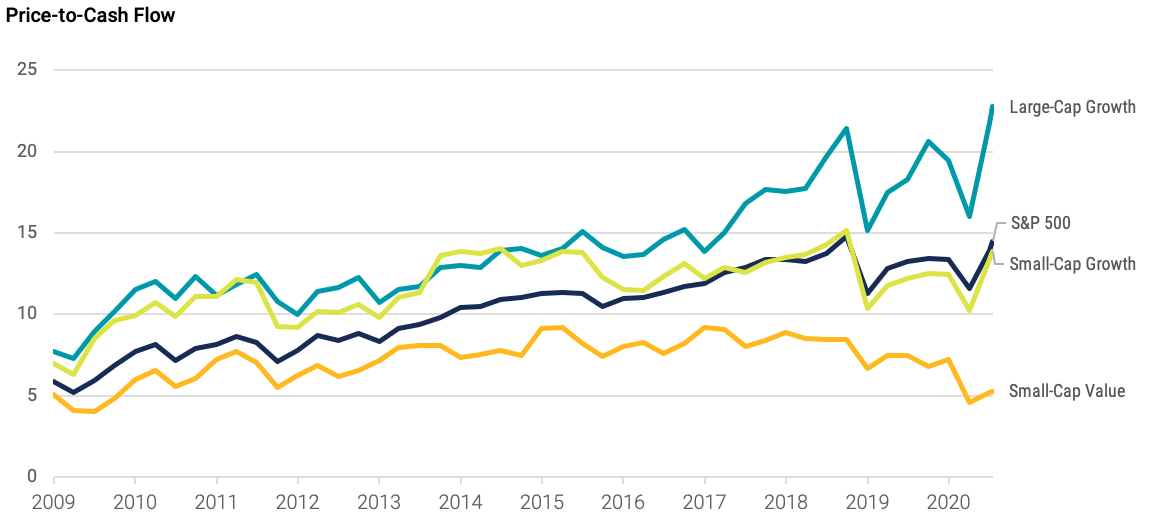
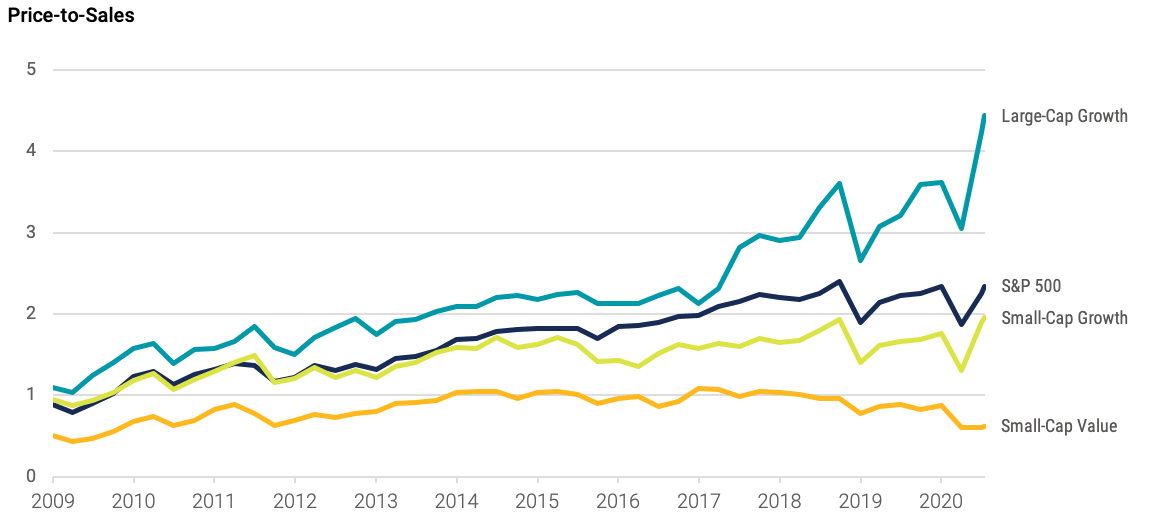
Where do these valuation spreads sit today? Figure 2 plots U.S. large-cap growth, U.S. large caps, U.S. small-cap growth and U.S. small-cap value stocks across several commonly used valuation ratios. What we see, compared to both longer term averages and other parts of the market, is large-cap growth stocks are trading at very high multiples.
The trends are similar in each chart, so let’s focus on price-to-earnings (P/E). As of July 15, large growth stocks were trading at a price multiple of 33.86 relative to earnings compared to the average P/E ratio of 21.11 since 2009. Additionally, if we compare to other parts of the market, the P/E ratio for large growth stocks is 43% higher than large-cap stocks (23.63) and 173% higher than small-cap value stocks (12.41).
While we can’t know what the future will bring, we can say that now, more than any time in recent history, investors in growth stocks are baking in very high expectations of future earnings growth (that may or may not materialize) or extremely low expected returns.
FIGURE 2 | NO MATTER HOW YOU LOOK AT IT, LARGE-CAP GROWTH VALUATIONS ARE HIGH


Data from 12/31/2008 - 7/15/2020. Style and size represented by Russell indices. Source: Morningstar.
GLOSSARY
Price-to-Earnings Ratio (P/E): The price of a stock divided by its annual earnings per share. These earnings can be historical (the most recent 12 months) or forward-looking (an estimate of the next 12 months). A P/E ratio allows analysts to compare stocks on the basis of how much an investor is paying (in terms of price) for a dollar of recent or expected earnings. Higher P/E ratios imply that a stock's earnings are valued more highly, usually on the basis of higher expected earnings growth in the future or higher quality of earnings.
Price-to-Book Ratio (P/B): Price per share divided by book value (net assets) per share.
Price-to-Cash Flow Ratio (P/CF): Price per share divided by annual operating cash flow per share.
Price-to-Sales Ratio (P/S): Price per share divided by annual revenue per share.
Russell 3000® Index: Measures the performance of the largest 3000 U.S. companies representing approximately 98% of the investable U.S. equity market.
S&P 500® Index: The S&P 500® Index is composed of 500 selected common stocks most of which are listed on the New York Stock Exchange. It is not an investment product available for purchase.
The opinions expressed are those of the portfolio team and are no guarantee of the future performance of any Avantis fund.
This material has been prepared for educational purposes only. It is not intended to provide, and should not be relied upon for, investment, accounting, legal or tax advice.
This information does not represent a recommendation to buy, sell or hold a security. The trading techniques offered do not guarantee best execution or pricing.
Mutual fund investing involves market risk. Investment return and fund share value will fluctuate. It is possible to lose money by investing in mutual funds.
The contents of this Avantis Investors presentation are protected by applicable copyright and trademark laws. No permission is granted to copy, redistribute, modify, post or frame any text, graphics, images, trademarks, designs or logos.