It’s Going Down: An Update on Interest Rates

Key Takeaways
The Fed cut rates by 0.50% in September 2024, with more cuts anticipated through the year and in 2025.
Historically, we’ve seen rate cut cycles take a similar path to current expectations. Rates have often fallen quickly once cuts have begun.
Falling rates have historically benefited intermediate-duration bonds as well as small-value stocks.
In September, the Federal Reserve (Fed) made its first cut to the federal funds rate since March 2020 – a 0.50% reduction. Now, expectations from both the Fed and market participants are for more cuts, and in relatively short order. Recently released Fed estimates project two more 0.25% cuts in the policymakers’ last two meetings of the year. They also estimate the fed funds rate to be about 3.4% by the end of 2025. The current target rate is 4.75-5.00%.
As of the market close on September 30, market expectations were slightly more aggressive. Prices on fed futures contracts suggested that the highest probability outcomes are two more cuts in 2024 (total reduction of 0.75% over those two meetings) and cuts in each of the first four meetings of 2025. That would bring the federal funds rate to a target range of 3.00-3.25%. Figure 1 shows all implied probabilities by target rate range for the next nine Federal Open Market Committee (FOMC) meetings.
Figure 1 | The Market Expects Several More Rate Cuts Ahead

Data as of 9/30/2024. Source: CME FedWatch.
The History of Fed Rate Cuts
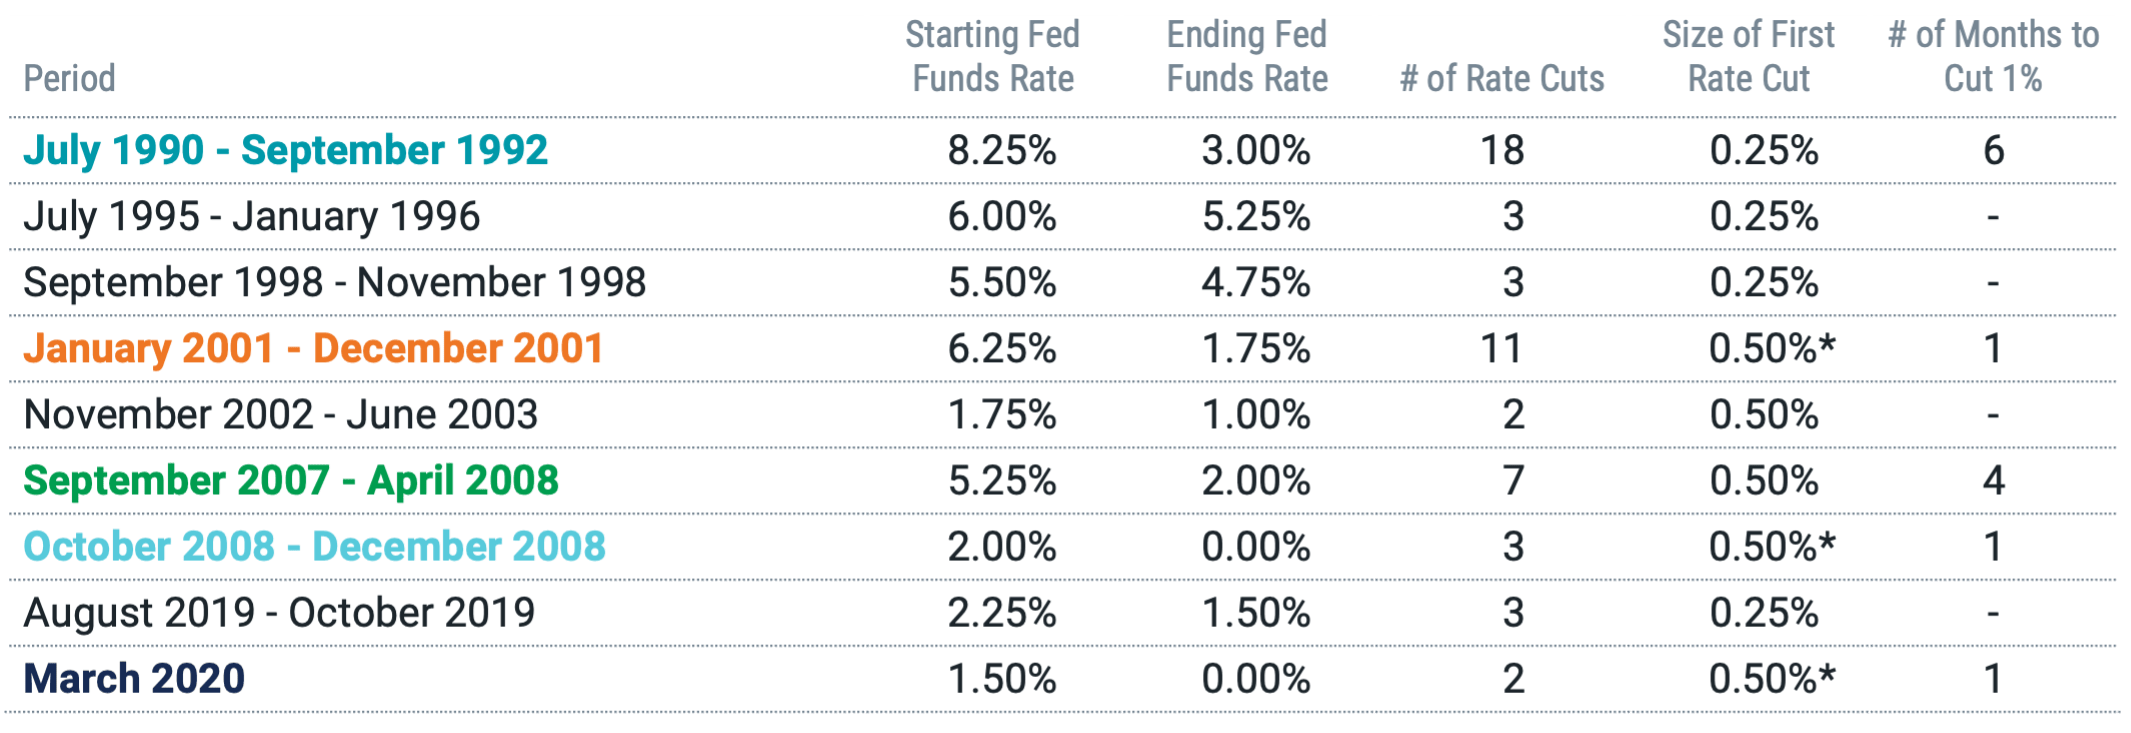
If these predictions on the path of interest rates feel overzealous, take a look at how the Fed has handled interest rate decisions in the past. In Figure 2 Panel A, we share details on each time the Fed has lowered the fed funds rate since 1990. Before that, the Fed didn’t target a specific fed funds rate.
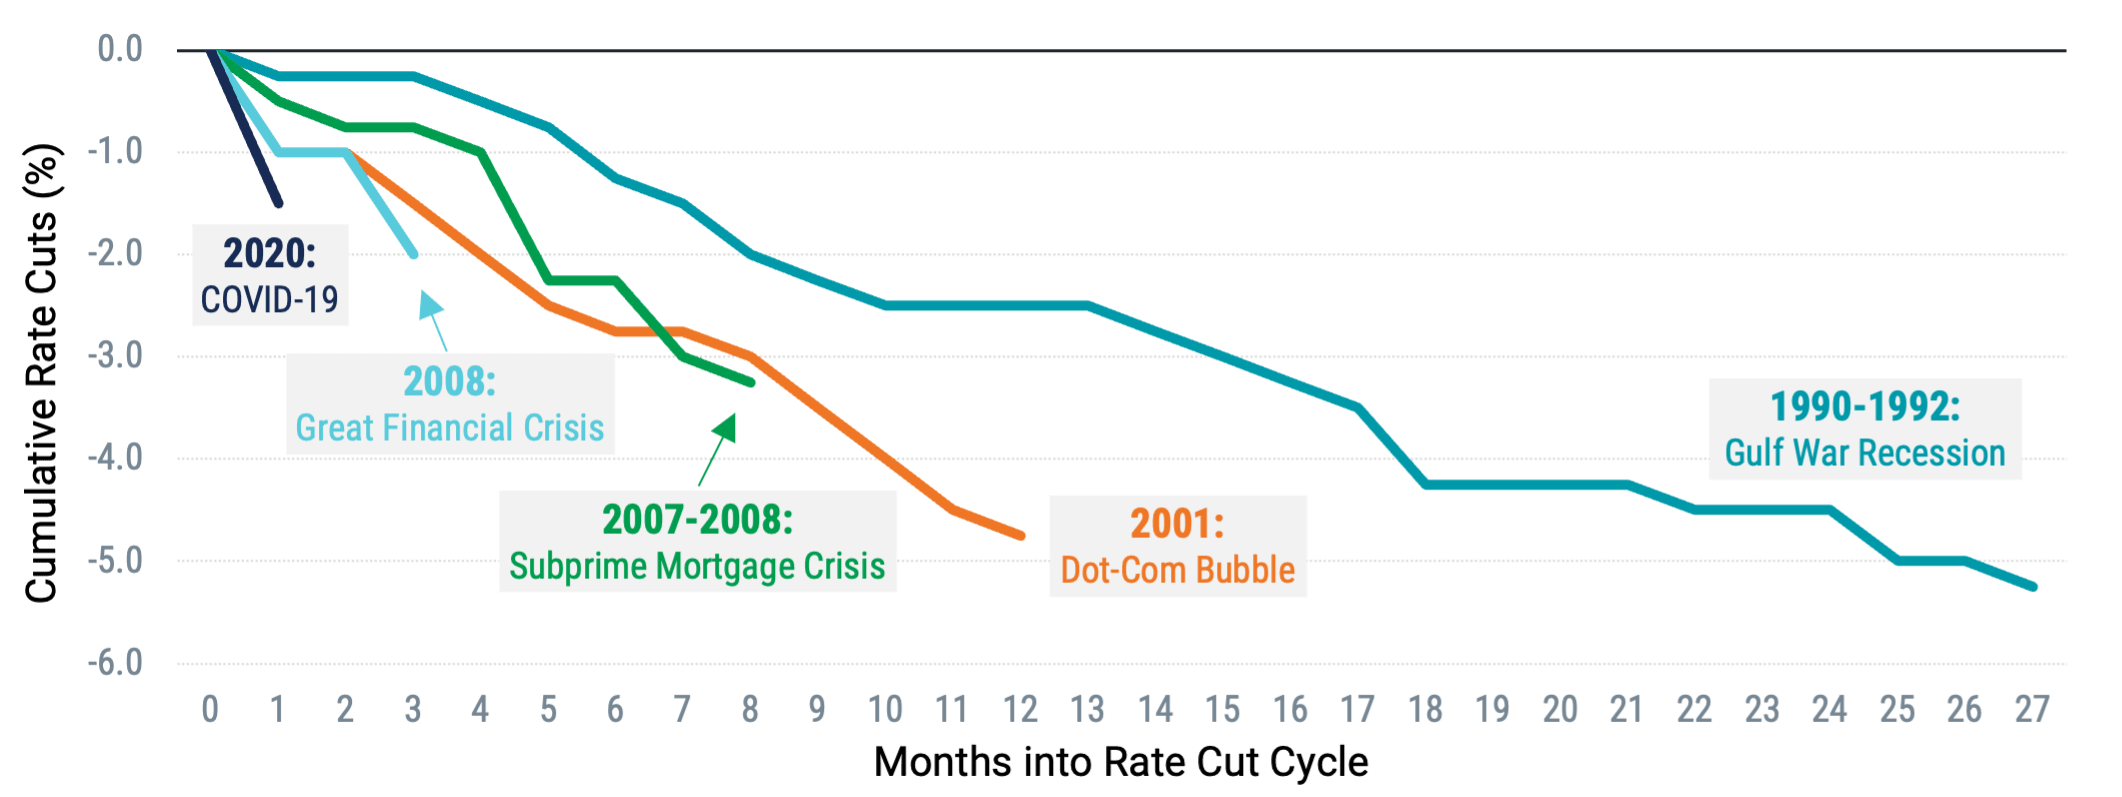
We observe nine distinct periods of rate cuts, and it’s clear that some have quite different characteristics than others. Four of the nine periods saw the fed funds rate decline by less than 1%. During the other five periods, the average rate change from the first to the last rate cut was more than 3% and, in each case, with a cumulative cut of at least 1% occurring within six months. Figure 2 Panel B depicts those five periods showing cumulative rate cuts by month after each cycle began. It’s evident that historically when the Fed has cut rates in similar magnitudes to their current projections, it has happened fast.
Figure 2 | History of Fed Funds Rate Cuts Since 1990

*Multiple rate cuts occurred in the first month of the cycle via emergency FOMC meetings. The figure shown reflects only the first rate-cut decision.

Source: Michael Adams, “Federal Funds Rate History 1990 to 2024,” Forbes, September 18, 2024.
The Impact of Bond Duration During Falling-Rate Environments
For many investors, the question now is what these expected rate cuts could mean for their portfolios. With more than $5 trillion currently in government money market funds, a more specific question is what impact will duration have during a period of declining interest rates.
With money market funds, the attraction of late has been yields generally around 5% without much concern for price sensitivity to changes in interest rates given the amortized cost structure of money market funds that allows them to maintain a typically constant $1 price. That also means that as rates on short-term bonds come down (money market funds are required to maintain a weighted average maturity of 60 days or less), overall yield for money market funds should decline (in particular in the presence of new cash flows diluting existing yields) without any potential benefit from price appreciation.
Bond prices tend to go up as yields go down, but money market investors don’t receive this benefit due to the amortized cost structure and short duration of the underlying securities.
We examined how intermediate core bonds have performed in past interest rate environments, using the Bloomberg U.S. Aggregate Bond Index since its inception in 1976. Given the current expectations for fairly quick rate declines, we’ve computed the analysis over short time horizons: three months and six months.
The results are shown in Figure 3, which includes annualized average returns for the index for each time horizon during periods when rates rose by more than 1%, when rates were relatively stable and stayed within plus-or-minus 1%, and when rates fell by more than 1%. We find that historically, intermediate core bonds have delivered significantly higher annualized average returns when rates fall quickly versus in more stable or fast-rising interest rate environments.
Figure 3 | Intermediate Core Bonds Have Delivered Higher Returns When Rates Fall Quickly

Data from 1/1/1976 - 8/30/2024. Source: Avantis Investors, Bloomberg, FRED. Number of three-month and six-month periods when rates rise by >1% are 49 and 96, when rates stay within +/- 1% are 469 and 380, and when rates fall by >1% are 63 and 102. Past performance is no guarantee of future results.
How Stocks Have Performed When Rates Fall
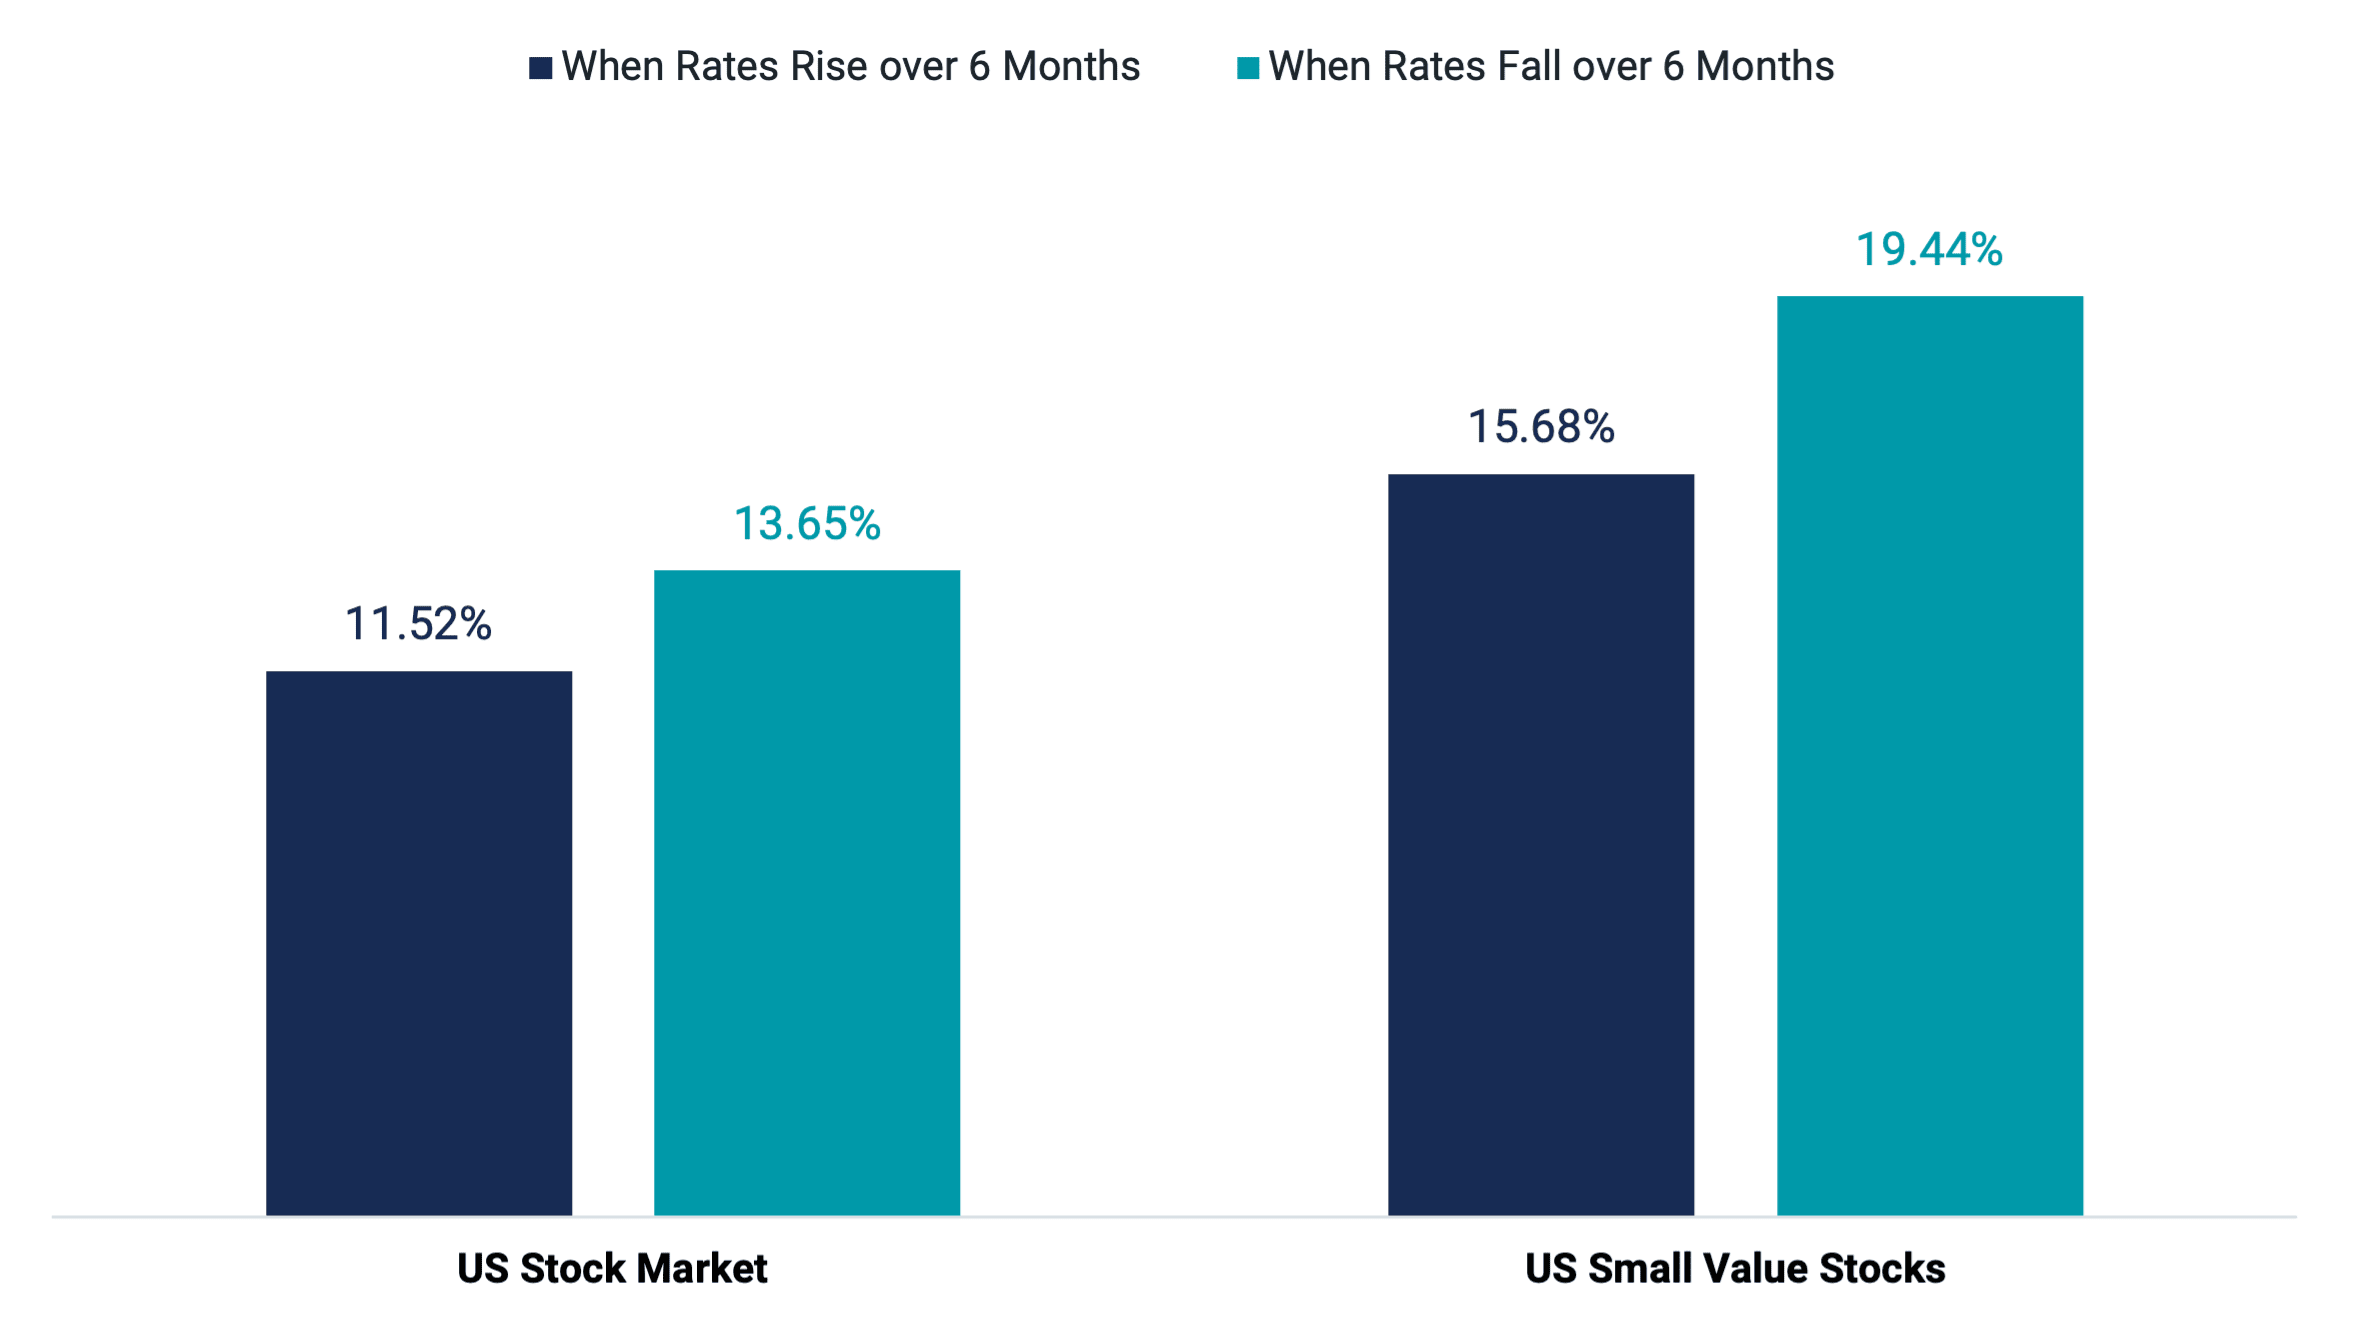
Adding to our analysis on interest rate changes, we calculated the performance of U.S. stocks (total market and small-cap value) since 1976. Now that we are presenting multiple asset classes, we narrow the scenarios to when rates rise and fall over six-month periods for simplicity.
In Figure 4, we show that whether rates have risen or fallen over six-month periods, stocks have on average, outperformed core bonds and small-value stocks have outperformed the total stock market. Perhaps more interesting is the spread in average returns between small-value stocks and the total market during the different environments.
Figure 4 | Lower-Priced Stocks Have Historically Fared Well in Falling-Rate Environments

Data from 1/1/1976 - 8/30/2024. Source: Avantis Investors, Ken French Data Library, FRED. The U.S. stock market is represented by the Market Portfolio and Small Cap Value by the Small Value Portfolio from the Ken French Data Library. The number of six-month periods when rates rise is 303, and when rates fall is 248. Past performance is no guarantee of future results.
The difference in average small value and total market returns when rates rise during the sample period is 4.2%. When rates have fallen, the outperformance for small-value stocks over the market rises to 5.8%. So, while low-priced stocks don’t outperform the market every month or even every year, periods of falling rates have historically been favorable for value investors.
The Bottom Line
While nothing is ever guaranteed with respect to the path of interest rates, the expectations are clear and largely aligned between the Fed and the market that the Fed funds rate is currently well above the so-called “neutral rate” and should decline going forward.
Moreover, the Fed’s expected pace of rate cuts is now even faster than what we observed earlier in the year. The data tells us that historically, in quickly falling rate environments, extending duration beyond cash or money market funds has, on average, led to better outcomes for investor portfolios. And, as we believe is true every day, considering valuations within equity allocations is expected to benefit investors, but historically that benefit has been more impactful when rates are going down.
Explore More Insights
Glossary
Bloomberg U.S. Aggregate Bond Index: Represents securities that are taxable, registered with the Securities and Exchange Commission, and U.S. dollar-denominated. The index covers the U.S. investment-grade fixed-rate bond market, with index components for government and corporate securities, mortgage pass-through securities and asset-backed securities.
Duration: Measures how long it takes, in years, for an investor to be repaid a bond’s price by the bond’s total cash flows. It is also a measure of a bond’s interest rate sensitivity. The longer the duration, the more sensitive a bond is to interest rate shifts.
Federal Funds Rate (Fed Funds Rate): An overnight interest rate banks charge each other for loans. More specifically, it's the interest rate charged by banks with excess reserves at a Federal Reserve district bank to banks needing overnight loans to meet reserve requirements.
Fed Futures Contract: An agreement to buy or sell a specific amount of a commodity or financial instrument at a particular price on a stipulated future date, based on the federal funds rate. Futures contracts are typically used as a hedging/risk management tool in portfolio management.
Federal Reserve (Fed): The Fed is the U.S. central bank, responsible for monetary policies affecting the U.S. financial system and the economy.
FOMC (Federal Open Market Committee): The committee that sets interest rate and credit policies for the Federal Reserve System, the U.S. central bank. The committee decides whether to increase or decrease interest rates through open-market operations of buying or selling government securities.
Yield: For bonds and other fixed-income securities, yield is a rate of return on those securities. There are several types of yields and yield calculations. "Yield to maturity" is a common calculation for fixed-income securities, which takes into account total annual interest payments, the purchase price, the redemption value, and the amount of time remaining until maturity.
Investment return and principal value of security investments will fluctuate. The value at the time of redemption may be more or less than the original cost. Past performance is no guarantee of future results.
This material has been prepared for educational purposes only. It is not intended to provide, and should not be relied upon for, investment, accounting, legal or tax advice.
The opinions expressed are those of the portfolio team and are no guarantee of the future performance of any Avantis fund.
Generally, as interest rates rise, the value of the bonds held in the fund will decline. The opposite is true when interest rates decline.
Contact Avantis Investors
inquiries@avantisinvestors.com
This website is intended for Institutional and Professional Investors, not Retail Investors.